For the last months I have been writing a few blogs about the projects that I had to do at Flatiron as part of the requirements of the Data Science bootcamp that I’m doing. Now I’m almost at the end of the program and I’m still missing a couple blogs. One is a mandatory one about our Capstone Project and the second I decided to write about something that I really enjoy in Python which is manipulating dataframes with Pandas.
If by any chance you don’t know what these two are (Pandas and dataframes), Pandas (Python Data Analysis Library) is the most popular open source data analysis and manipulation tool/library built on top of Python; and Dataframes are 2-dimensional labeled data structure with columns of potentially different types. You can think of it like a simple spreadsheet or SQL table, and it is generally the most commonly used Pandas object.
This blog will be by no means a tutorial but just a summary of what so far I have found to be some of the most useful functionalities to manipulate dataframes, and in order for me to show them to you, I thought starting from scratch would be good, scratch meaning creating my own dataframe.
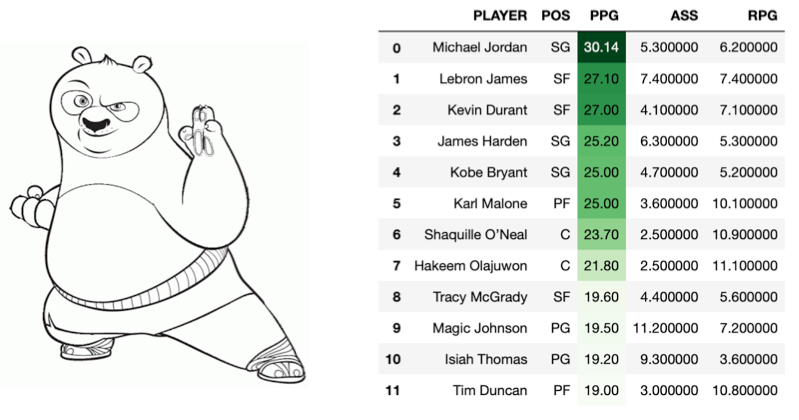
In terms of the dataset, I won’t be downloading/loading any but instead I will create my own based on NBA basketball players names, positions, and a few of the most simple stats such as PPG (Points Per Game), APG (Assists Per Game), and RPG (Rebounds Per Game), so nothing too fancy and I will do this as an exercise embedding Gists so that I don’t have to re-type all the code and will just go over it.
#pandas #towards-data-science #dataframes #data-science #pandas-dataframe