Learn how to use a Node.js builtin method for investigating the memory usage of any given process.
What you will learn
- How to get information about the memory of a Node.js process
- How Node.js organizes the memory
Requirements
To follow along you need a basic understanding of Javascript and a Node.js installation.
How does Node.js organizes the memory?
A blog post won’t be enough to explain all the machinery: you should just be concerned about the heap for now so let’s start by breaking down the basics.
The heap is a memory segment used for storing objects, strings and closures. This is where all the magic happens.
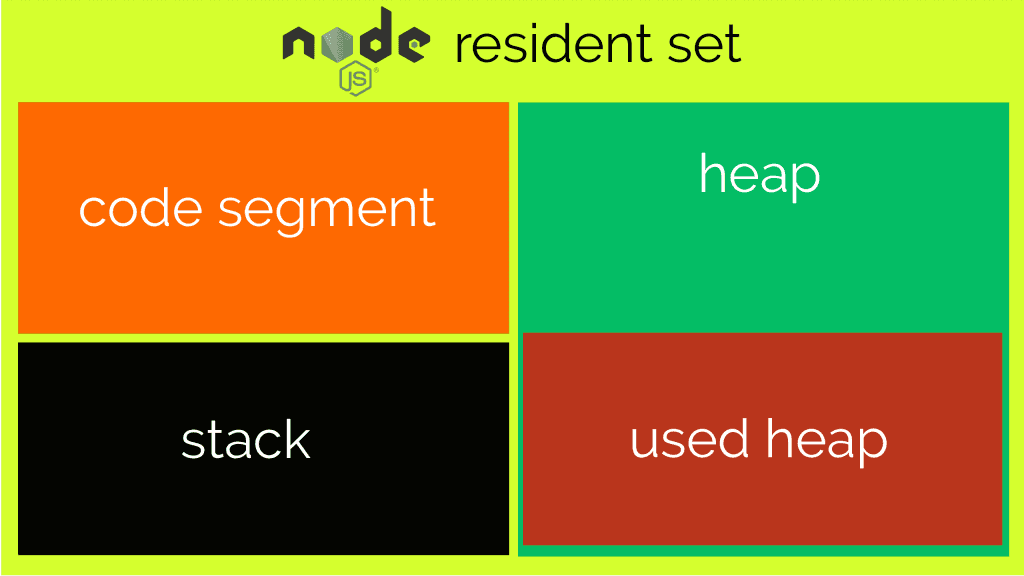
The heap is part of something bigger though: a running Node.js process store all its memory inside a Resident Set. You can think of it as of a big box which contains some more boxes.
The Resident Set contains also the actual Javascript code (inside the Code segment) and the Stack, where all the variables live. Hopefully the following illustration will clarify the concept:
Sounds complicated? We need to focus only on the heap for now, so don’t worry if you can’t grasp all the terminology right now!
Querying the Node.js heap
We know what the Resident Set is and we also know that the Heap is what we’re looking for: now we need to find out how much heap is used by a given Node.js process. But how do we access the heap?
process is a global Node.js object which contains information about the current Node.js process, and it provides exactly what we were searching for: the memoryUsage() method.
memoryUsage returns an object with various information: rss, heapTotal, heapUsed, external:
- rss stands for Resident Set Size, it is the total memory allocated for the process execution
- heapTotal is the total size of the allocated heap
- heapUsed is the actual memory used during the execution of our process . external is, according to the documentation, the memory used by “C++ objects bound to JavaScript objects managed by V8”
Armed with the knowledge we are ready to see some examples.
Testing reverse() memory usage for a small array
In our first example we will see how much memory is used by a very basic method: reverse(). reverse is an array method: it takes an array and reverses its content.
Create a new file named reverse_node.js:
const arr = [1, 2, 3, 4, 5, 6, 9, 7, 8, 9, 10];
arr.reverse();
const used = process.memoryUsage().heapUsed / 1024 / 1024;
console.log(`The script uses approximately ${Math.round(used * 100) / 100} MB`);
Now if you run this script you should see the following output:
This script uses approximately 3.6 MB of memory
In the example above I picked the property heapUsed from process.memoryUsage() but if you run process.memoryUsage() by itself, you will have access to the other properties as listed in the previous section. For instance by running:
const arr = [1, 2, 3, 4, 5, 6, 9, 7, 8, 9, 10];
arr.reverse();
const used = process.memoryUsage();
for (let key in used) {
  console.log(`${key} ${Math.round(used[key] / 1024 / 1024 * 100) / 100} MB`);
}
You’ll see the following output:
rss 25.63 MB
heapTotal 5.49 MB
heapUsed 3.6 MB
external 0.01 MB
Now, this is not the most accurate way for measuring the memory consumption in Node.js but at least you’ll get the job done.
There is more to take care about when doing instrumenting, in particular you should account for the Node.js garbage collector. Besides that, with memoryUsage you have at least an indication about how much memory a given script/process takes.
Let’s continue with another example!
#node #web-development #programming #javascript #developer