Ticket-to-ride is one of the very few strategic board games and it requires that players need a lot of planning and strategy building in the process. With the simple application of network analysis and graph theory concepts, it is possible that one can play this game even more efficiently. In this article, I will share some of my results from the computational analysis on the Ticket-to-ride board game. Also, I will discuss how to build the best strategies for this game.
Before we proceed, let me clarify that this article is not to introduce the game or its rules to you, it is expected that the audience of this article is familiar with the game. Anyways, for those of you who are unfamiliar about the game and its rules, visit this page Ticket to Ride Wiki
Building the structure
We will be using the popular python package [networkx](https://networkx.github.io/) to build the graph structures. To fit in the current context, cities are represented as nodes and segments between cities can be represented as edges. Then we construct the network using the below code.
Once the network is constructed, we can quickly see the basic info using the code below.
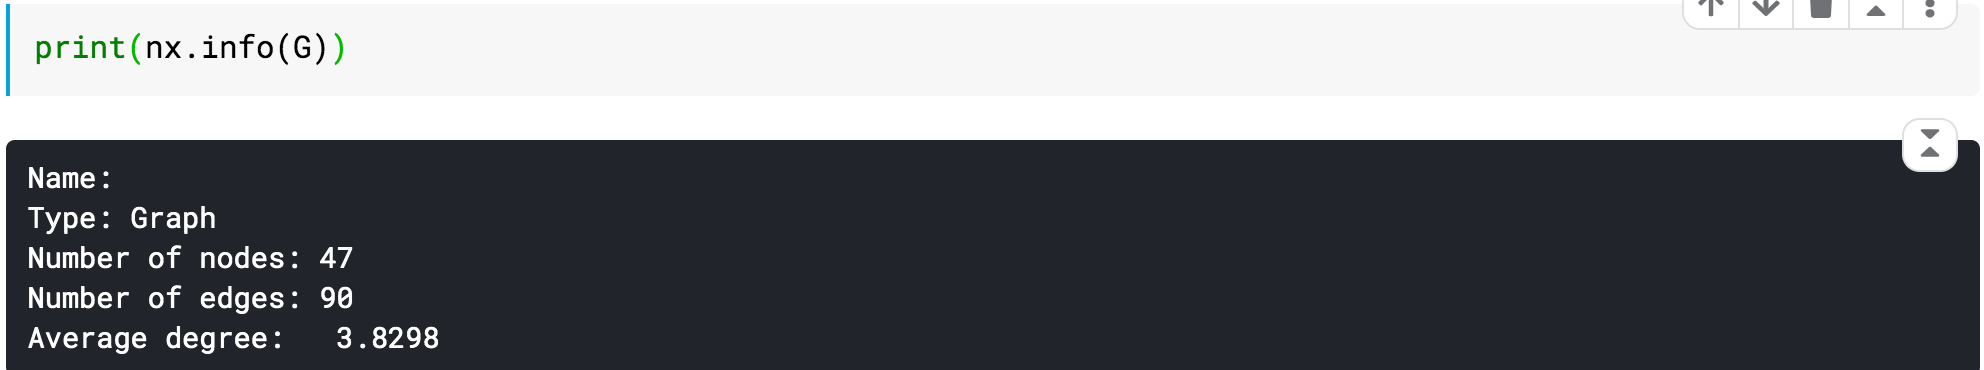
It can be noted from above that the network has 47 cities (nodes) and 90 tracks (edges).
Basic Stats
In network theory, the degree of a node is the number of edges that it is connected to, which translates to the number of tracks that a city is connected to. Based on a degree distribution chart shown below (Fig-1), it can be observed that the degree of all cities ranges between 1–7. About 15 cities have a degree of 4 and 14 cities have a degree of 3. There is only one city with a maximum degree of 7 and two cities with a degree of 6.
#data-science #python #network-analysis #board-games #ticket-to-ride