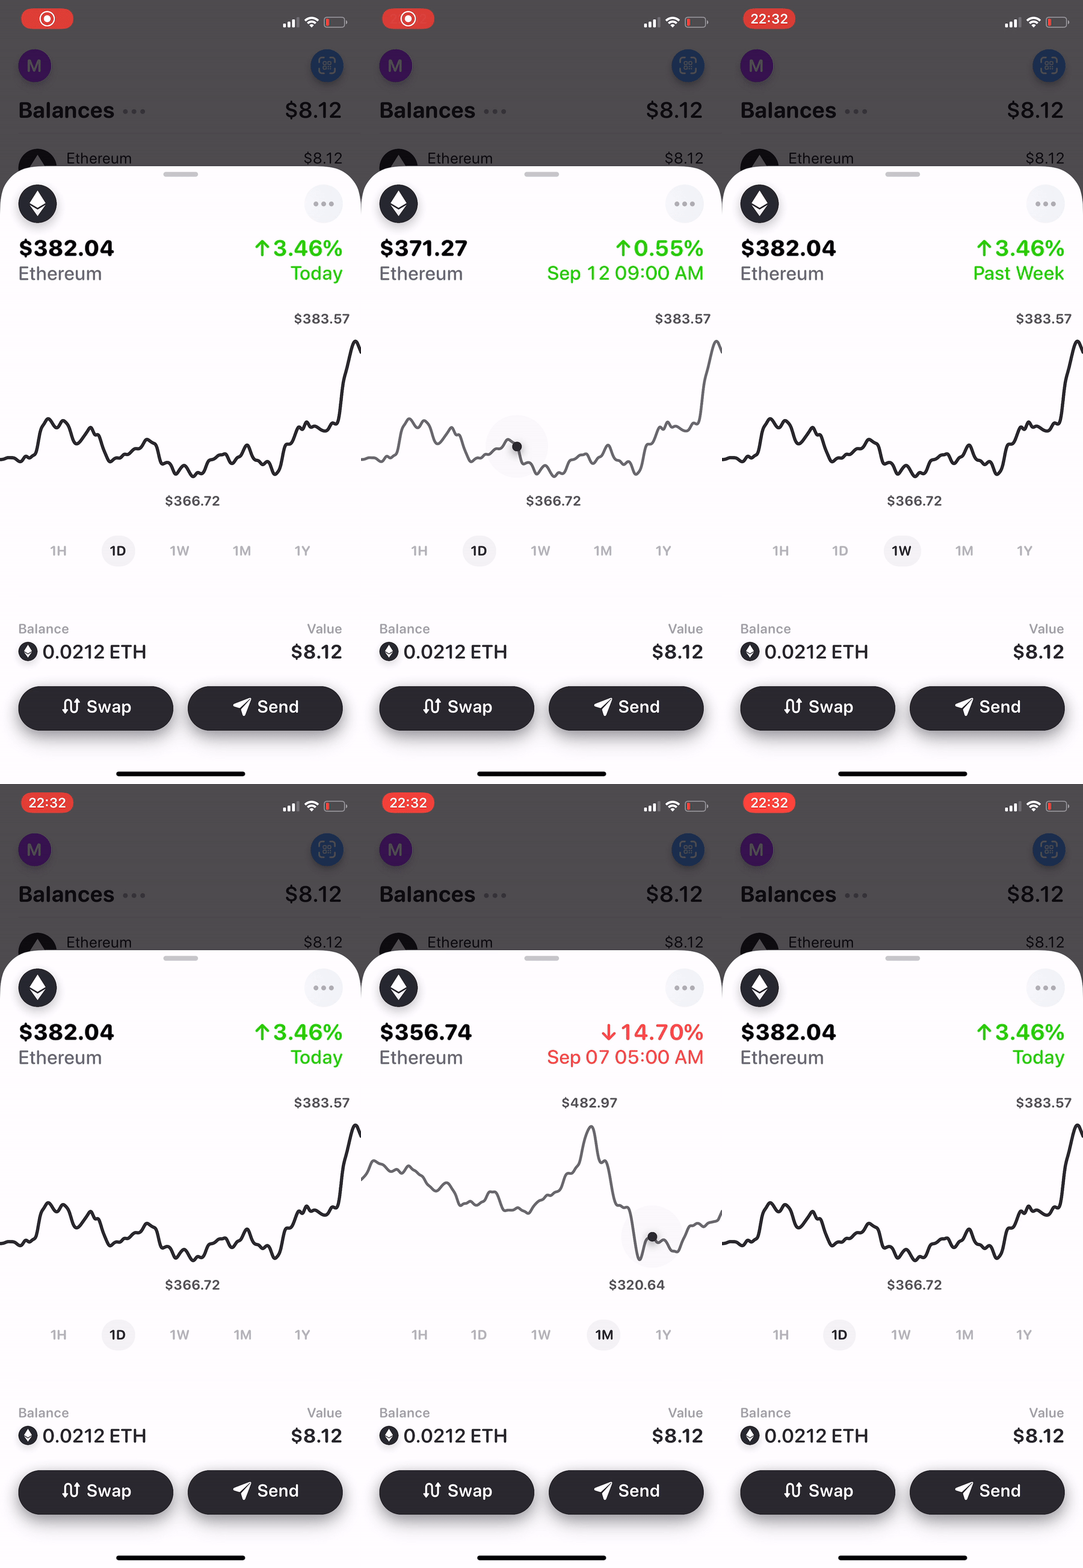
Animated Charts in React Native
A set of components and helpers for building complex and beautifully animated charts in React Native apps.
The library was designed to create aesthetic, animated (so far only linear) charts based on a given input.
The main assumptions of the library were to create smooth transitions between subsequent data sets.
Install & Import:
# NPM
$ npm i @rainbow-me/animated-charts –save
import React from ‘react’;
import {Dimensions, View} from ‘react-native’;
import {ChartDot, ChartPath, ChartPathProvider, monotoneCubicInterpolation} from ‘@rainbow-me/animated-charts’;Basic Usage:
export const {width: SIZE} = Dimensions.get('window');
export const data = [
  {x: 1453075200, y: 1.47}, {x: 1453161600, y: 1.37},
  {x: 1453248000, y: 1.53}, {x: 1453334400, y: 1.54},
  {x: 1453420800, y: 1.52}, {x: 1453507200, y: 2.03},
  {x: 1453593600, y: 2.10}, {x: 1453680000, y: 2.50},
  {x: 1453766400, y: 2.30}, {x: 1453852800, y: 2.42},
  {x: 1453939200, y: 2.55}, {x: 1454025600, y: 2.41},
  {x: 1454112000, y: 2.43}, {x: 1454198400, y: 2.20},
];
const points = monotoneCubicInterpolation(data)(40);
const BasicExample = () => (
  <View style={{ backgroundColor: 'black' }}>
    <ChartPathProvider data={{ points, smoothingStrategy: 'bezier' }}>
      <ChartPath height={SIZE / 2} stroke="yellow" width={SIZE} />
      <ChartDot style={{ backgroundColor: 'blue' }} />
    </ChartPathProvider>
  </View>
);
Preview:

Download Details:
Author: rainbow-me
Live Demo: View The Demo
Download Link: Download The Source Code
Official Website: https://github.com/rainbow-me/react-native-animated-charts
License: MIT

1.00 GEEK