Internet of Things (IoT) and 5G technologies will involve an astounding amount of data recording the links between people, device, event, location, and time. According to IDC’s forecast, there will be 79.4 zettabytes of data generated by 41.6 billion IoT devices in 2025. With the rapid growth of IoT data and IoT applications, there is an ever rising demand for a highly efficient spatial-temporal data science workflow to gain insights from the overwhelming data.
Scalability is key to building productive data science pipelines. To address this scalability challenge, we launched Arctern, an open source spatial-temporal analytic framework for boosting end-to-end data science performance. Arctern aims to improve scalability from two aspects:
- Unified data analytic and processing interface across different platforms, from laptops to clusters and cloud;
- Rich and consistent algorithms and models, including trajectory processing, spatial clustering and regression, etc., across different data science pipeline stages.
The rest of this article probes into the current geospatial data science pipelines and reviews the tools, libraries, and systems used in each stage. By discussing the existing workflows’ deficiencies, we underscore the importance of scalability. We will show that well-scaled interfaces, algorithms, and models not only reduce the time to solve mathematical or technical problems, but also improve the efficiency of collaboration and communication between data scientists and engineers.
A brief review of spatial-temporal data science workflows
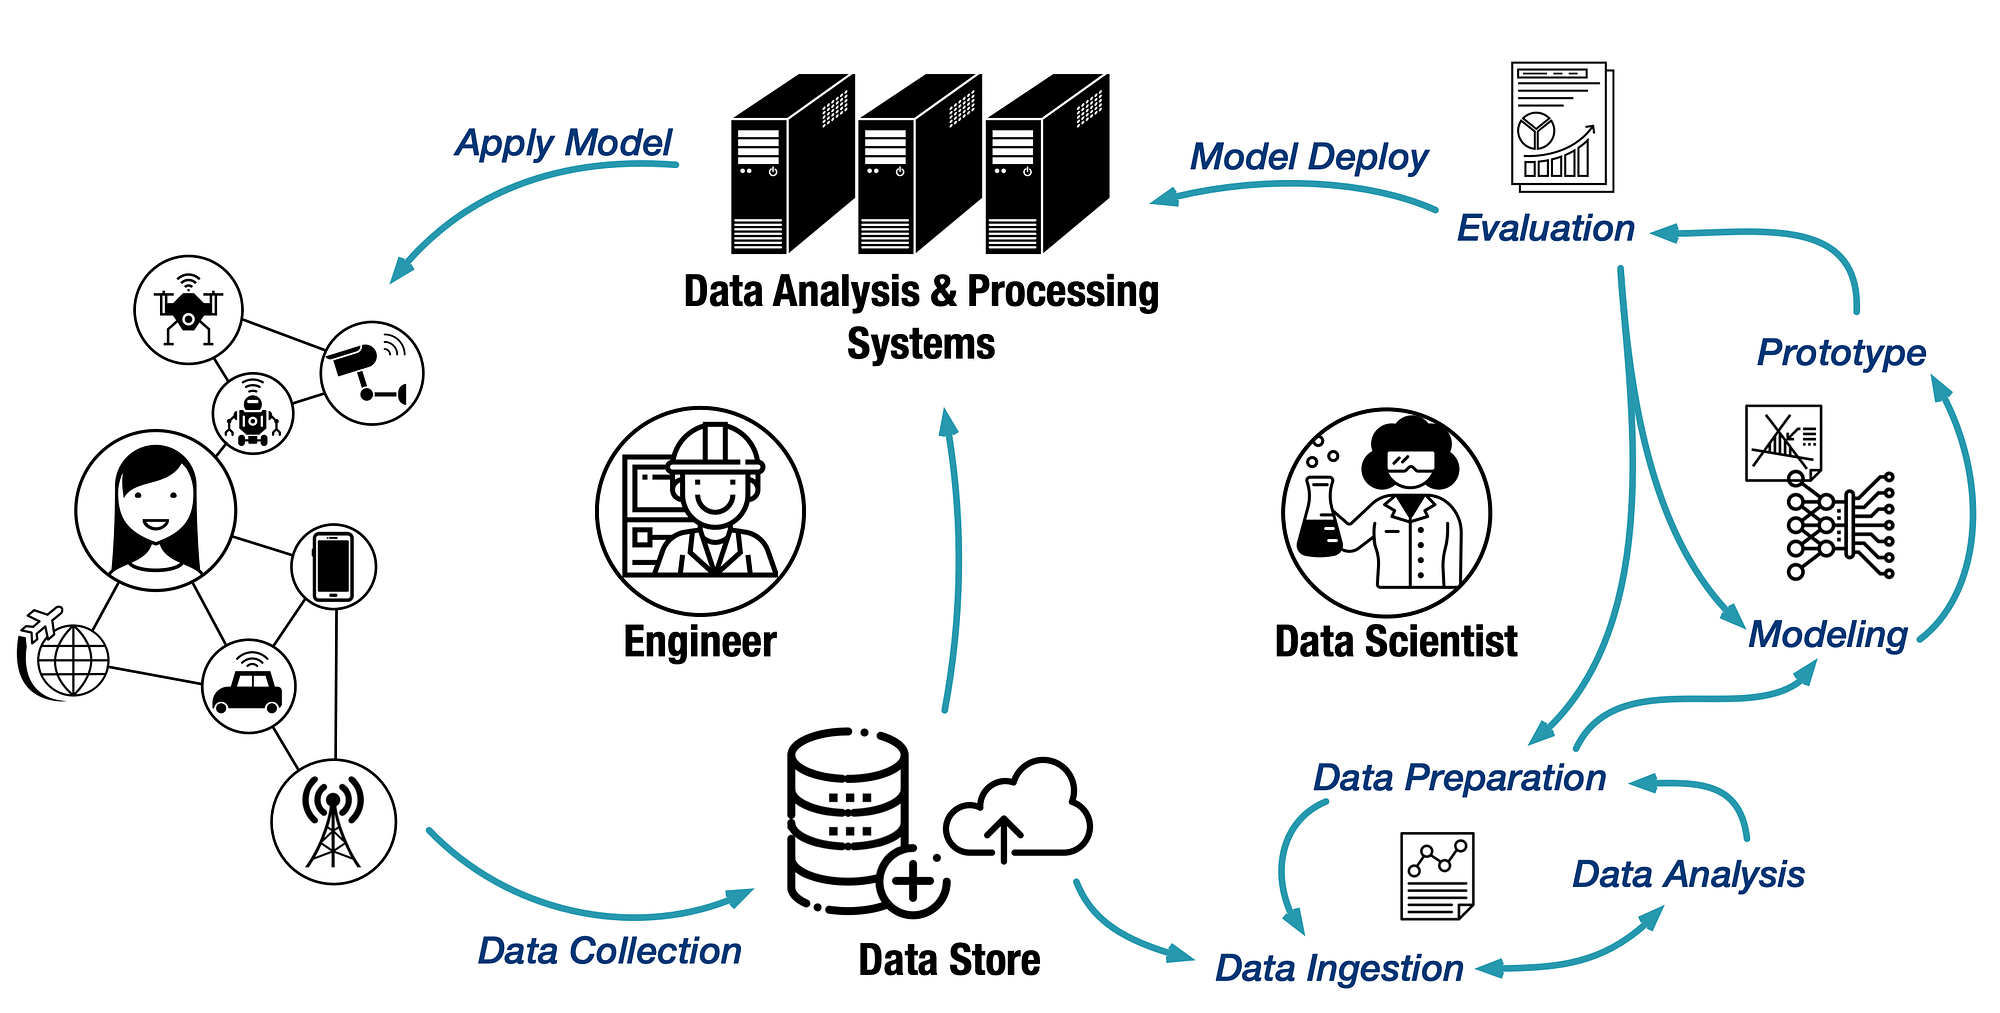
To better understand the scalability problem existing in the current workflows, we need to take a look at the pipeline of spatial-temporal data science, which is illustrated in the figure above. Raw data is first generated by IoT devices, and then collected by data store. Data scientists make exploratory analysis over these data. Basing on technical hypothesis and data features, they select proper models to develop a prototype for answering business questions. After a few iterations of evaluation and adjustment, the model will finally be deployed on a data processing system, which in turn delivers better services to end users via IoT devices.
The whole process can break down to three stages:
- Prototype development. In this stage, data scientists tend to work with small datasets for the purpose of fast data exploration, efficient model selection, and iterative prototype polishing. Lightweight tools are favored in this stage, because they can provide quick insights and support fast iteration. Typical tools include NumPy, GeoPandas, scikit-learn, PySAL, and kepler.gl.
- Model evaluation. To fit the prototype into the production environment, much larger (or even close to production level) datasets are used for model evaluation. As a result, the model evaluation-modification iterations in this stage are much less agile than in the prototype stage. Moreover, the tool chain is much heavier. Most of the commonly-used tools, such as PostGIS and PySpark, are disk-based, or distributed.
- Model deployment. Deployment is the stage where the model is integrated into the existing production environment to provide practical services. This stage involves large-scale systems such as HDFS, Hbase, TSDB for storage, and Spark, Flink, GeoMesa for data processing.
#geopandas #postgis #arctern-project #geospatial #data-science #data analysis