This tutorial was created to democratize data science for business users (i.e., minimize usage of advanced mathematics topics) and alleviate personal frustration we have experienced on following tutorials and struggling to apply that same tutorial for our needs. In light of this, our mission is as follows:
- Provide practical application of data science tasks with minimal usage of advanced mathematical topics
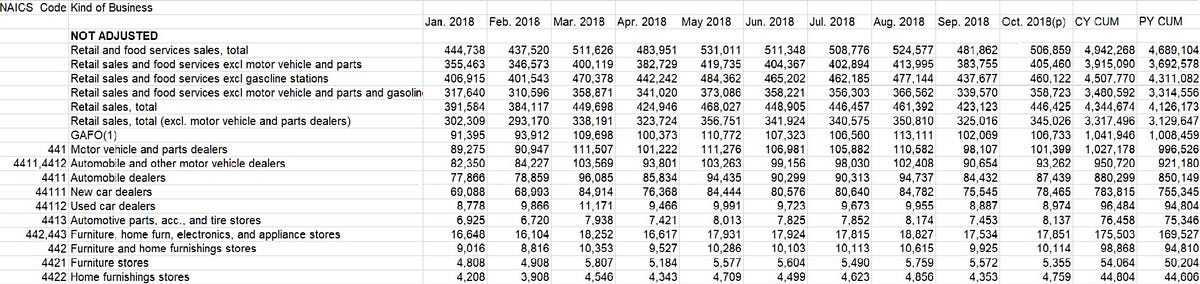
- Only use a full set of data, which are similar to data we see in business environment and that are publicly available in a tutorial, instead of using simple data or snippets of data used by many tutorials
- Clearly state the prerequisites at beginning of the tutorial. We will try to provide additional information on those prerequisites
- Provide both written tutorial and video tutorial on each topic to ensure all steps are easy to follow and clearly illustrated
1. Description
This is part one of series on how to create a forecast, using one of the most widely used data science tool — Excel. If you are surprised by this statement, then we refer you to www.kdnuggets.com (one of the most widely followed blog for data science). They conduct annual poll on tools and according to the poll, Excel is one of the most widely used tool by data scientists (https://www.kdnuggets.com/2018/05/poll-tools-analytics-data-science-machine-learning-results.html). If you have a question about using Excel, just ask any data scientist in your organization. They are most likely to be Excel expert and they will probably be able to assist you.
Forecasting is the process of making predictions of the future based on past and present data and its trend. The accuracy of forecast decreases as you stretch out your forecast. For example, if you are forecasting monthly sales then accuracy of forecast for month 1 sales of forecast will be higher than month 2 sales of forecast and so on. One of my co-worker likes to state that best way to predict tomorrow’s weather is to assume it is similar to today’s weather. Everything else is just a guess.
Forecasting Series consists of:
- Part 1.1— Create Forecast using Excel 2016/2019
- Part 1.2 — Advanced Topics on Forecast using Excel 2016/2019
- Part 2.1 — Create Forecast using Python — ARIMA (https://medium.com/@sungkim11/create-forecast-using-python-arima-part-2-1-efca5c5c14f3)
- Part 2.2 — Advanced Topics on Forecast using Python — ARIMA
- Part 2.3 — Extend Forecast (Python) to include What-If Analysis Capabilities — ARIMA
- Part 31 — Create Forecast using Python — Prophet (https://medium.com/@sungkim11/create-forecast-using-python-prophet-3-1-5ea64c3b103b)
- Part 3.2 —Advanced Topics on Forecast using Python — Prophet
- Part 3.3 — Extend Forecast (Python) to include What-If Analysis Capabilities — Prophet
- Part 4.1 — Create Forecast using Python — LSTM (https://medium.com/@sungkim11/create-forecast-using-python-lstm-4-1-1ab8b138a08f)
- Part 4.2 — Advanced Topics on Forecast using Python — LSTM
- Part 4.3 — Extend Forecast (Python) to include What-If Analysis Capabilities — LSTM
#data-science #forecasting #excel #machine-learning #forecast