Note from Towards Data Science’s editors:_ While we allow independent authors to publish articles in accordance with our rules and guidelines, we do not endorse each author’s contribution. You should not rely on an author’s works without seeking professional advice. See our Reader Terms for details._
Support and resistance are some of the most talked-about concepts when it comes to technical analysis. Support and resistance are used as price barriers, in which the price “bounces” off of. In this article, I will use the K-means clustering algorithm to find these different support and resistance channels, and trade with these insights.
Support and Resistance:
To understand how best to implement something, we should first understand the thing that we want to implement.
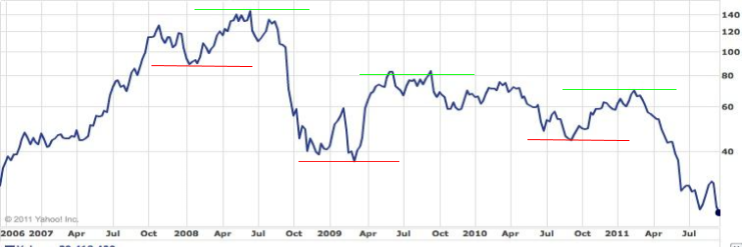
Self-drawn support and resistance levels. Image By Author
Support and Resistance, are two lines that are drawn on a graph, to form a channel, in which the price exists within.
Support and resistance are resultant of a security not being able to decrease or increase anymore, due to pressure from sellers or buyers. A good rule of thumb is that the more times a price is deflected against a support or resistance line, the less likely it will work again.
Support and resistance give good insight into entry points and selling points, as the support and resistance lines are theoretically the lowest and highest points for that limited time period.
Downsides of the support and resistance strategy is that it works for an unknown period of time, and the lines are subjective and are therefore subject to human error.
#algorithmic-trading #machine-learning #data-science #ai