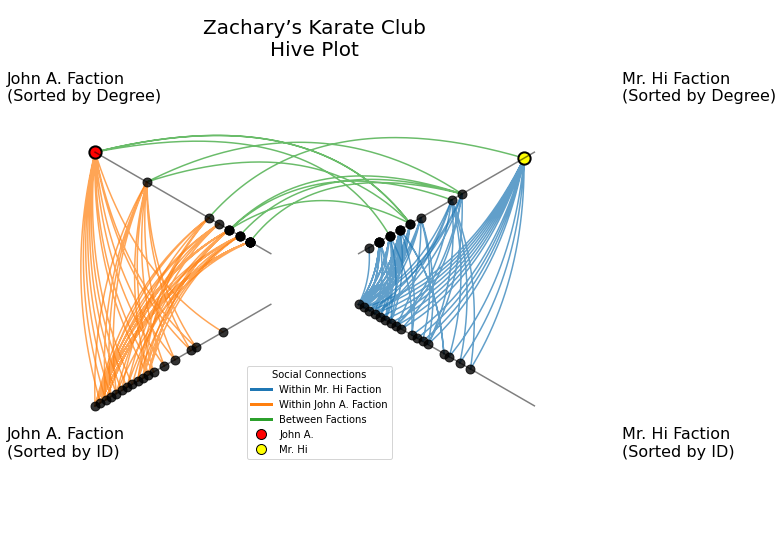
Introducing hiveplotlib— a new, open-source Python package for generating Hive Plots. Originally developed by Martin Krzywinski, Hive Plots generate well-defined figures that allow for interpretable, visual explorations of network data.
The hiveplotlib repository is visible to all on Gitlab, with documentation including further explanation of Hive Plots, examples (both toy data and real data), and full documentation of the code.
Hiveplotlib can be installed via pip:
$ pip install hiveplotlib
Currently, we only support matplotlib-based visualization, but we plan to extend hiveplotlib for use with interactive Python viz packages like bokeh, plotly, and holoviews.
Runtime
hiveplotlib scales nicely to large network datasets. As a demonstration on synthetic data, let’s build a Hive Plot similar to the “o” in the hiveplotlib logo:
from hiveplotlib import hive_plot_n_axes, Node
from hiveplotlib.viz import hive_plot_viz_mpl
import numpy as np
import matplotlib.pyplot as plt
num_nodes = 20
num_edges = 80
np.random.seed(0)
## build node data
nodes = []
for i in range(num_nodes):
    temp_node = Node(unique_id=i,
                     data={'a': np.random.uniform(),
                           'b': np.random.uniform(),
                           'c': np.random.uniform()})
    nodes.append(temp_node)
## give the nodes simple int IDs
node_ids = np.arange(num_nodes)
## build random edges
edges = np.random.choice(np.arange(num_nodes),
                         size=num_edges*2).reshape(-1, 2)
## construct HivePlot instance, evenly spacing out nodes over 3 axes
hp = hive_plot_n_axes(node_list=nodes, edges=edges,
                      axes_assignments=[
                          node_ids[:num_nodes//3],
                          node_ids[num_nodes//3:2*num_nodes//3],
                          node_ids[2*num_nodes//3:]
                      ], sorting_variables=["a", "b", "c"],
                      axes_names=["A", "B", "C"],
                      vmins=[0, 0, 0], vmaxes=[1, 1, 1],
                      orient_angle=-30)
## change the line kwargs for edges in plot
hp.add_edge_kwargs(axis_id_1="A", axis_id_2="B",
                   c=f"C0", lw=3, alpha=1, zorder=1.5)
hp.add_edge_kwargs(axis_id_1="B", axis_id_2="C",
                   c=f"C2", lw=3, alpha=1, zorder=1.5)
hp.add_edge_kwargs(axis_id_1="A", axis_id_2="C",
                   c=f"C1", lw=3, alpha=1, zorder=1.5)
fig, ax = hive_plot_viz_mpl(hive_plot=hp)
plt.show()
#hive-plot #towards-data-science #network #visualization #data-science