“I can’t breathe. I can’t breathe.”, That was the sentence uttered by Mr. Floyd more than 20 times while a police officer was kneeling on his neck after being arrested for allegedly using a fake 20 dollar bill. That tragic incident resulted in Mr. Floyd’s death and prompted a spasm of street protests. Consequently, it has reignited conversations about police brutality, racial profiling, policing, and police reform. About a month ago, I downloaded 28000+ fatal police incidents from Fatal Encounters with the goal of gaining an understanding of police killings in the U.S. The goal of this article is to share six things that I from aggregating a subset of the data.
The Dataset
The dataset comes from Fatal Encounters, a citizen science initiative that aggregates fatalities data and verifies media reports. Fatal Encounters systematically identifies cases in a prospective manner using online media reports and public records; additionally, cases are triple-checked by paid researchers who verify information across multiple media reports and public records. The resulting data is more comprehensive and reliable. The downloaded data has 28,335 rows and 29 variables:
- Unique ID
- Subject’s name
- Subject’s age
- Subject’sgender
- Subject’s race
- Subject’s race with imputations
- Imputation probability
- URL of image of deceased
- Date of injury resulting in death (month/day/year)
- Location of injury (address)
- Location of death (city)
- Location of death (state)
- Location of death (zip code)
- Location of death (county)
- Full Address
- Latitude
- Longitude
- Agency responsible for death
- Cause of death
- A brief description of the circumstances surrounding the death
- Dispositions/Exclusions INTERNAL USE, NOT FOR ANALYSIS
- Intentional Use of Force (Developing)
- Link to news article or photo of official document
- Symptoms of mental illness? INTERNAL USE, NOT FOR ANALYSIS
- Video
- Date&Description
- Unique ID formula
- Unique identifier (redundant)
- Date (Year)
I will only use two variables: “Date of injury resulting in death (month/day/year)”, and “Location of death (state)”.
Lesson 1 — Police fatalities have increased by more than 112% since 2000 with more than 1000 incidents each year since 2003
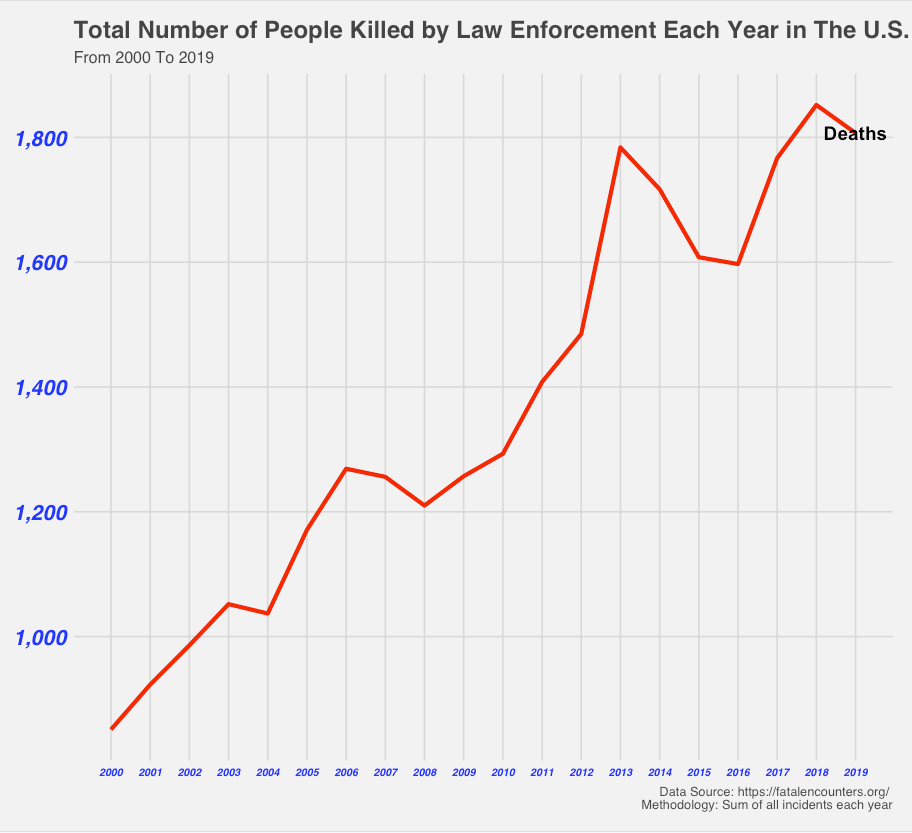
From the figures above, the annual number of deaths has increased steadily, with the number of incidents greater than 1,000 since 2003.
Lesson 2 — The Yearly percent change fluctuates between -6.35% and +15%
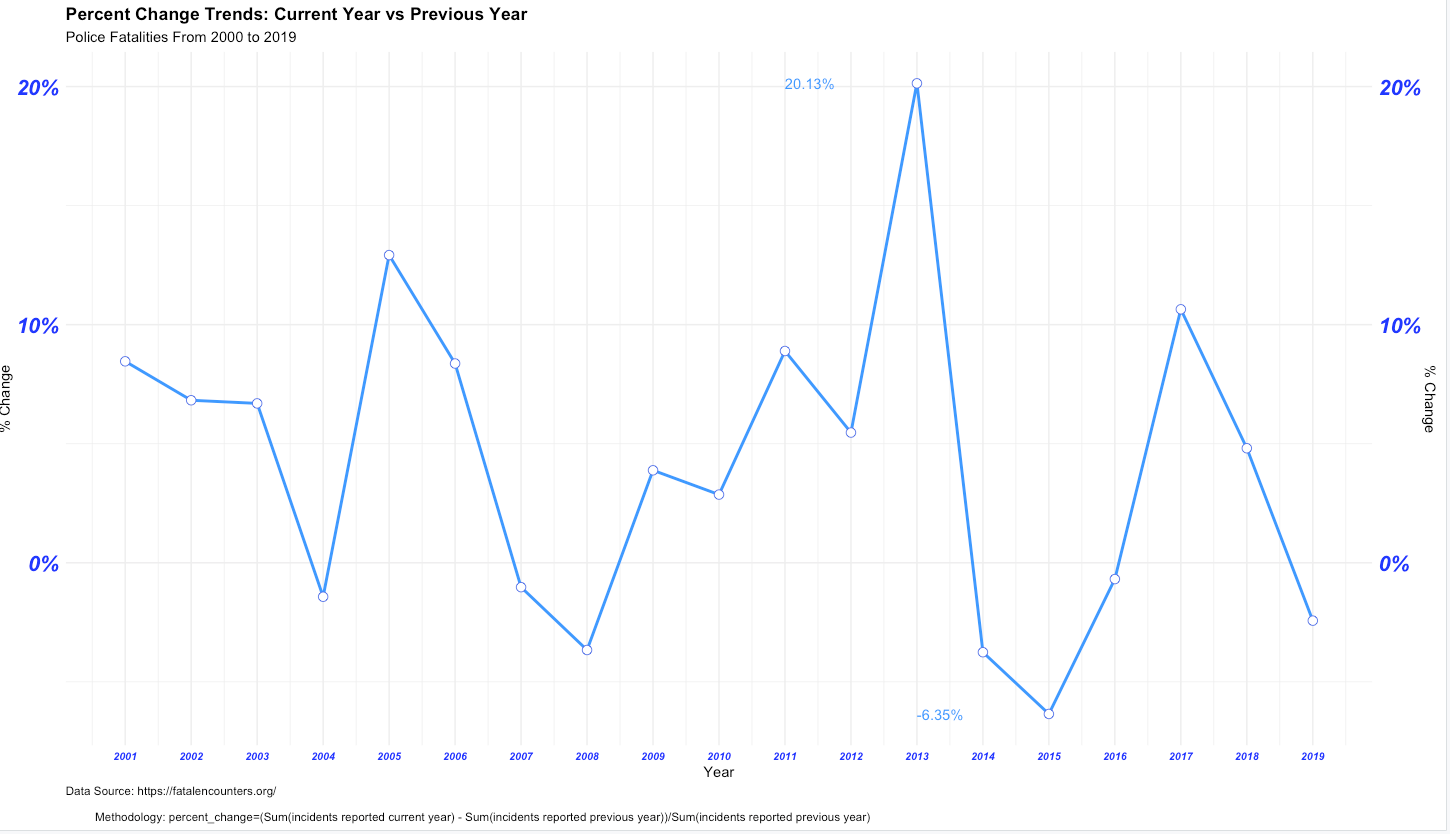
From the figures, the yearly percent change fluctuates mostly between -6.35% to 15%. Additionally, we have the highest increase (20.13%) in incidents from 2012 (1485 deaths) to 2013 (1784 deaths) about 301 more deaths in one year. That’s a lot.
#police-brutality #police-shooting #data-science #data analysis
