One of the things that I like most about Power BI is rapid report development. In just a few clicks, results can be visible and ready for analysis. Of course, complexity comes later, but that first visual impression can be easily achieved within a few minutes.
I’m sure that most of you have your own tips and tricks for boosting Power BI development. However, I would like to share my 5 tips, which I often use during the report development.
Tip #1 Measure Folders
Creating measures is a must for every Power BI report. And it’s not an issue when your report has just a few measures. But, things become more complicated when you need to operate with tens or even hundreds of measures.
To prevent that, I always use the following techniques to better organize my measures. By default, the measure will reside in the table where you created it.
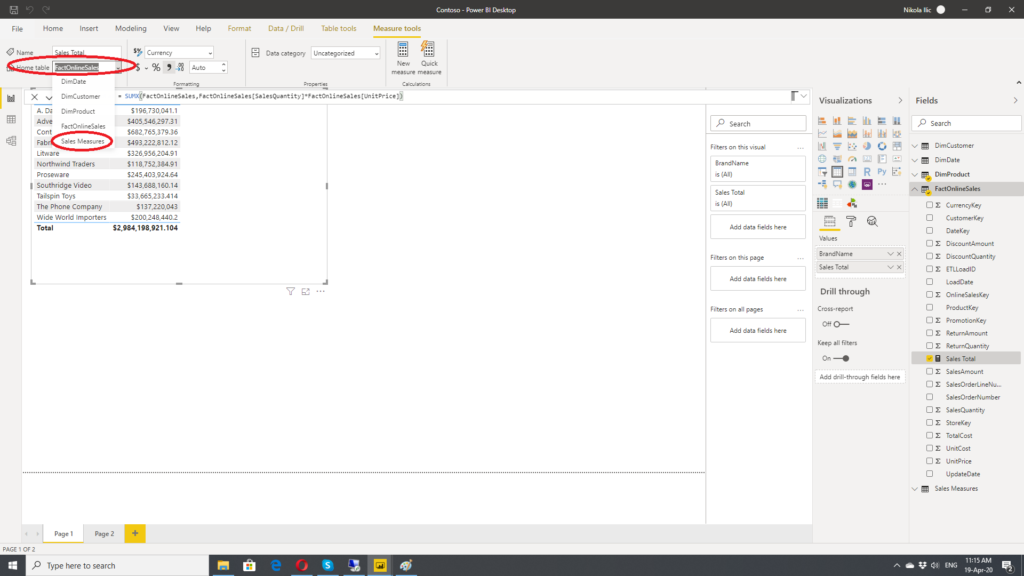
I’m using sample Contoso database and I’ve created a simple measure for calculating Sales Total in FactOnlineSales table:
Sales Total = SUMX(FactOnlineSales,
           FactOnlineSales[SalesQuantity]*FactOnlineSales[UnitPrice]
)

As you see, measure resides in the FactOnlineSales table, where it was originally created. In order to change this, I need to create a brand new table which will hold my measures.
Under the Home tab, select Enter Data and create a plain empty table called Sales Measures.
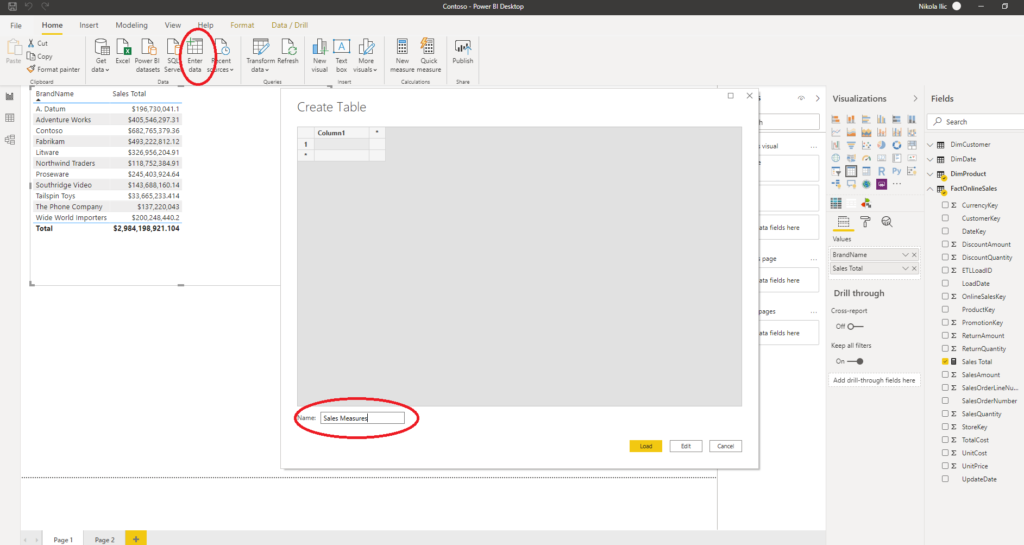
Click Load and you will see a new table in your model. After that, click on your measure Sales Total, and under Home table, select Sales Measures.
Then, just simply delete Column 1 and you are good to go. This way, you can separate and group your measures. Trust me, it will make your life much easier.
#data #power-bi #data-visualisation #tips-and-tricks #dashboard #data analysis