Example1: We have a data set from a hotel data with GDP of Singapore during the year 2014 to 2019. We will use regression analysis with seasonal fluctuation to predict the GDP for the year 2020.
Let us first take a look at the data
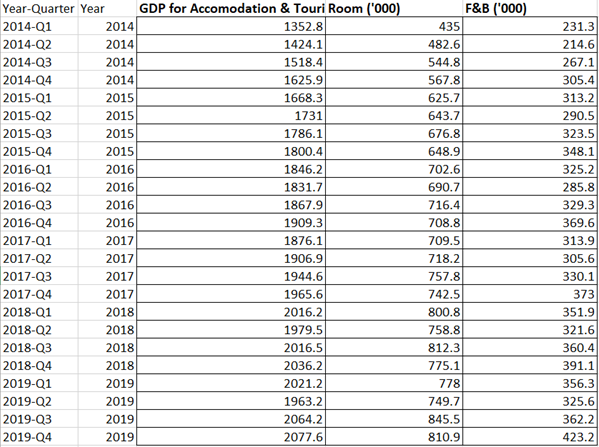
Hotel Date from 2014 to 2019
Lets us analyze the GDP growth during the year 2014 to 2019 using tableau.
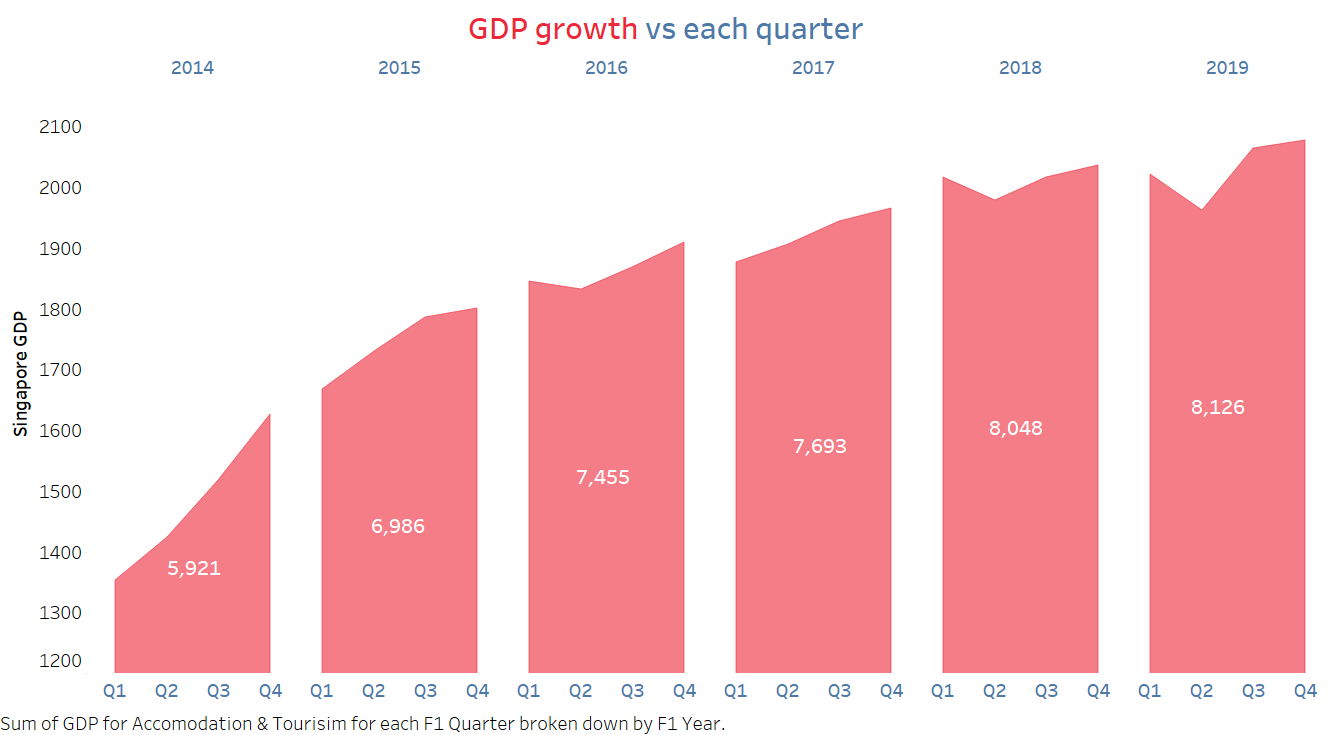
GDP between the year 2014 to 2019
We can see from the above chart seasonal fluctuations during the Q2 period in 2016, 2018, and 2019 there is a drop in GDP.
Let us now consider the same and try to analyse with a model which takes in seasonal quarterly fluctuation in GDP.
For this we will create three new columns Q1, Q2, Q3 to represent the four quarters as categorical.
Also, we include variable “t” to represent the increase in time period in a sequential manner ignoring quarters.
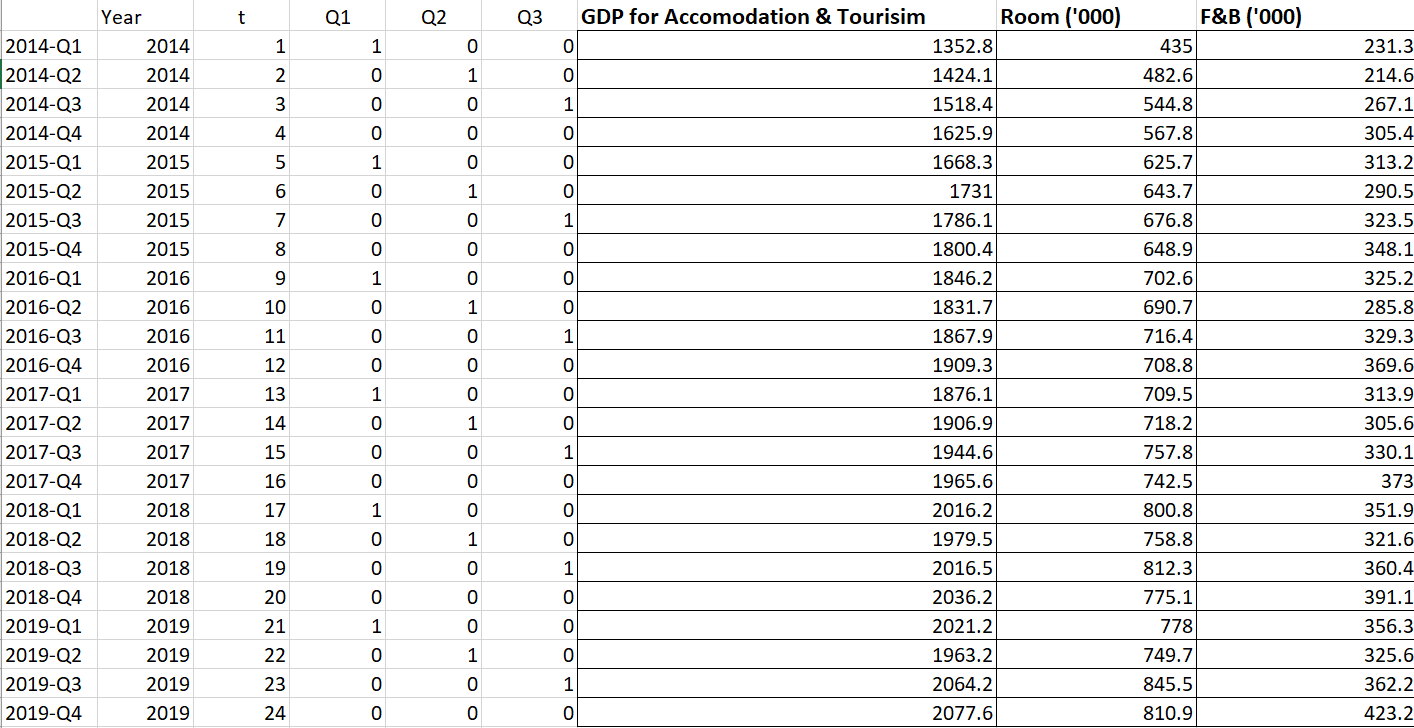
Variable included for seasonal data
We will now run multiple linear regression with data considering t, Q1, Q2, Q3 as an independent variable, and GDP as the dependent variable.
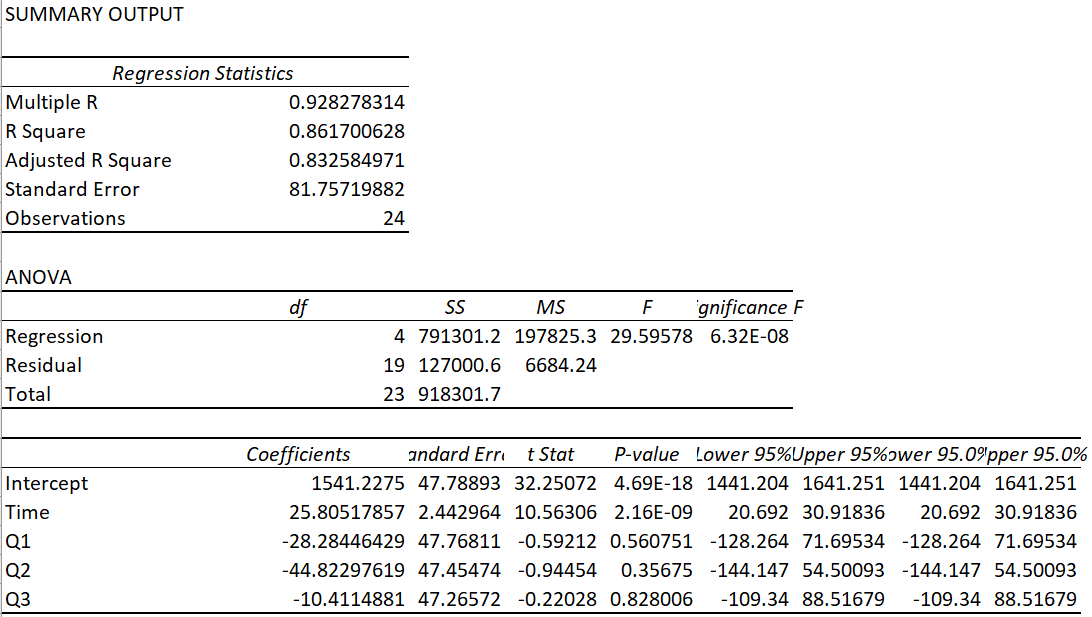
Multiple Regression
Model for GDP: 1541.22 +25.80t -28.28Q1–44.82Q2–10.41Q3
Now let us try to use the model to predict the GDP value between 2014 to 2019 and we can see that predicted values are very close to the actual GDP. Similarly, we can use the model to Predict GDP for the Year 2020.
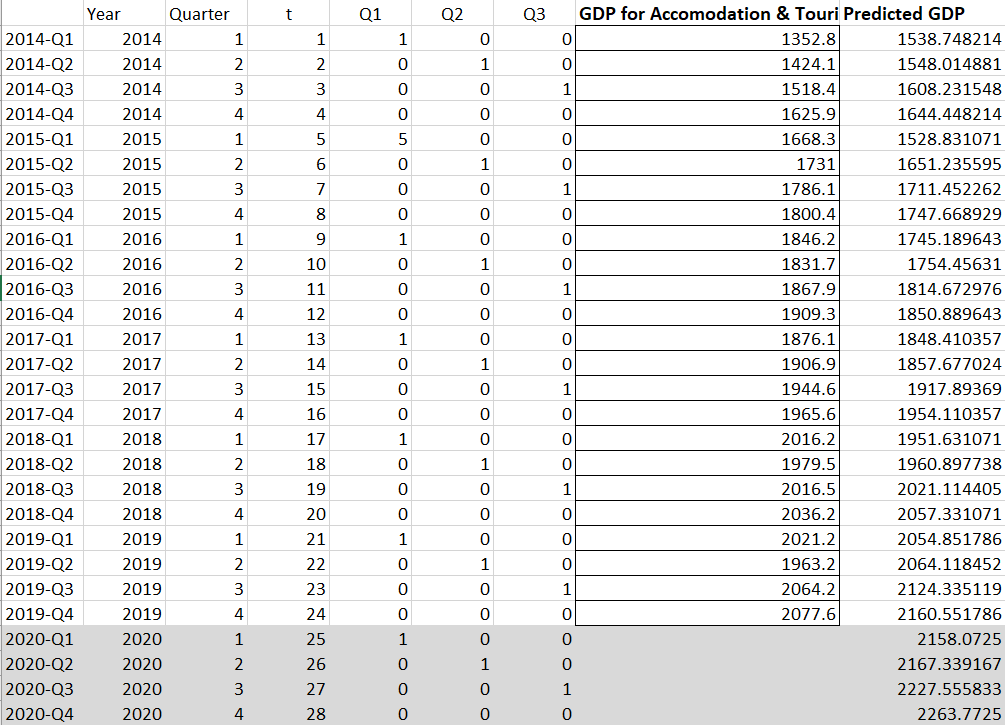
Predicted GDP for 2020
Finally, let us visualize the trend and prediction of GDP using tableau.
#regression-analysis #tableau #data analysis