ℹ️ This article is based on Go Delve 1.4.1.
A core dump is a file containing the snapshot of a program’s memory that has terminated unexpectedly. It can be used for post-mortem debugging to understand why the crash occurred and the variables involved in it. With GOTRACEBACK, Go provides an environment variable that controls the output generated when a program crashes. This variable can also force a core dump to be generated, making the debugging possible.
GOTRACEBACK
GOTRACEBACK controls the verbosity of the output when the program crashes. It can take different values:
nonedoes not display any goroutine stack traces.single, the default option, displays the current goroutine stack traces.alldisplays all the user-created goroutines stack traces.systemdisplays all the goroutines stack traces, even the one from the runtime.crashsimilar tosystem, but also generates a core dump.
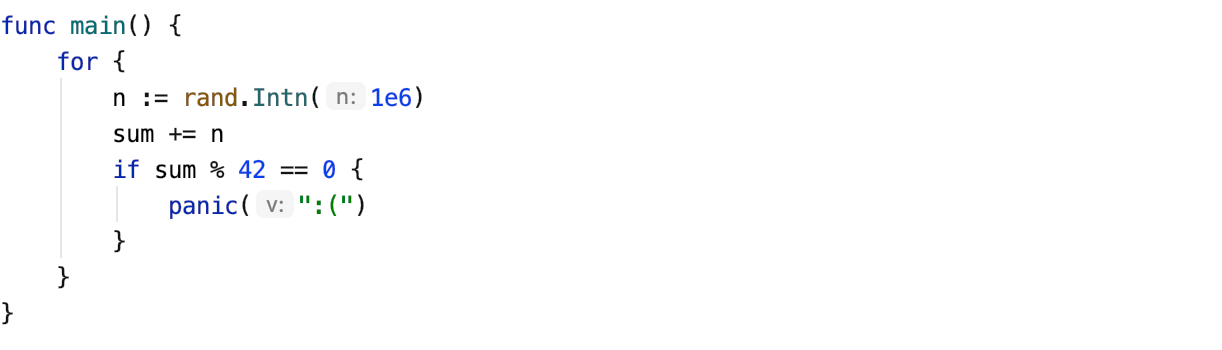
The last option gives us the ability to debug our program in case of crash. This can be a good option if you do not get enough logs, or the crash is not reproducible. Let’s take an example with the following program:
#debug-instrumentation #golang #go