Since the dawn of the United States of America, US presidential speeches have served as both a reflection of the current state of the nation and a call for changes in a direction that the President believes the country should go.
Presidential speeches provide an insight of what the nation’s leaders are thinking and hoping for the nation’s direction, and how they intend to use their power to fuel towards that direction. Their delivery of that information will affect the public’s reception to the message and ability for action to take place.
Using data science techniques and tools for Natural Language Processing and Unsupervised Learning, I set out to better understand Presidents’ use of their speeches’ power by examining the sentiment, sophistication of speech, and focus of content for over 990 presidential speeches. I would then look for trends, patterns, and other insights over time and by political party.
From George Washington’s 1789 First Inaugural Address to Jimmy Carter’s 1977 Address to the Nation On Energy to Donald Trump’s 2019 State of the Union, every president to date (year 2020) has representation in the speeches that were analyzed in this project*.
With that, here are my findings…
Sentiment of US Presidents
Tools used: TextBlob’s polarity and subjectivity
Speech sentiment was measured in two ways: polarity (i.e. more negative/sad in tone to more positive/happy in tone) and subjectivity (i.e. more fact-based to more opinion-based).
Below are the sentiment analysis results where each dot represents a different President and each color represent a political party >
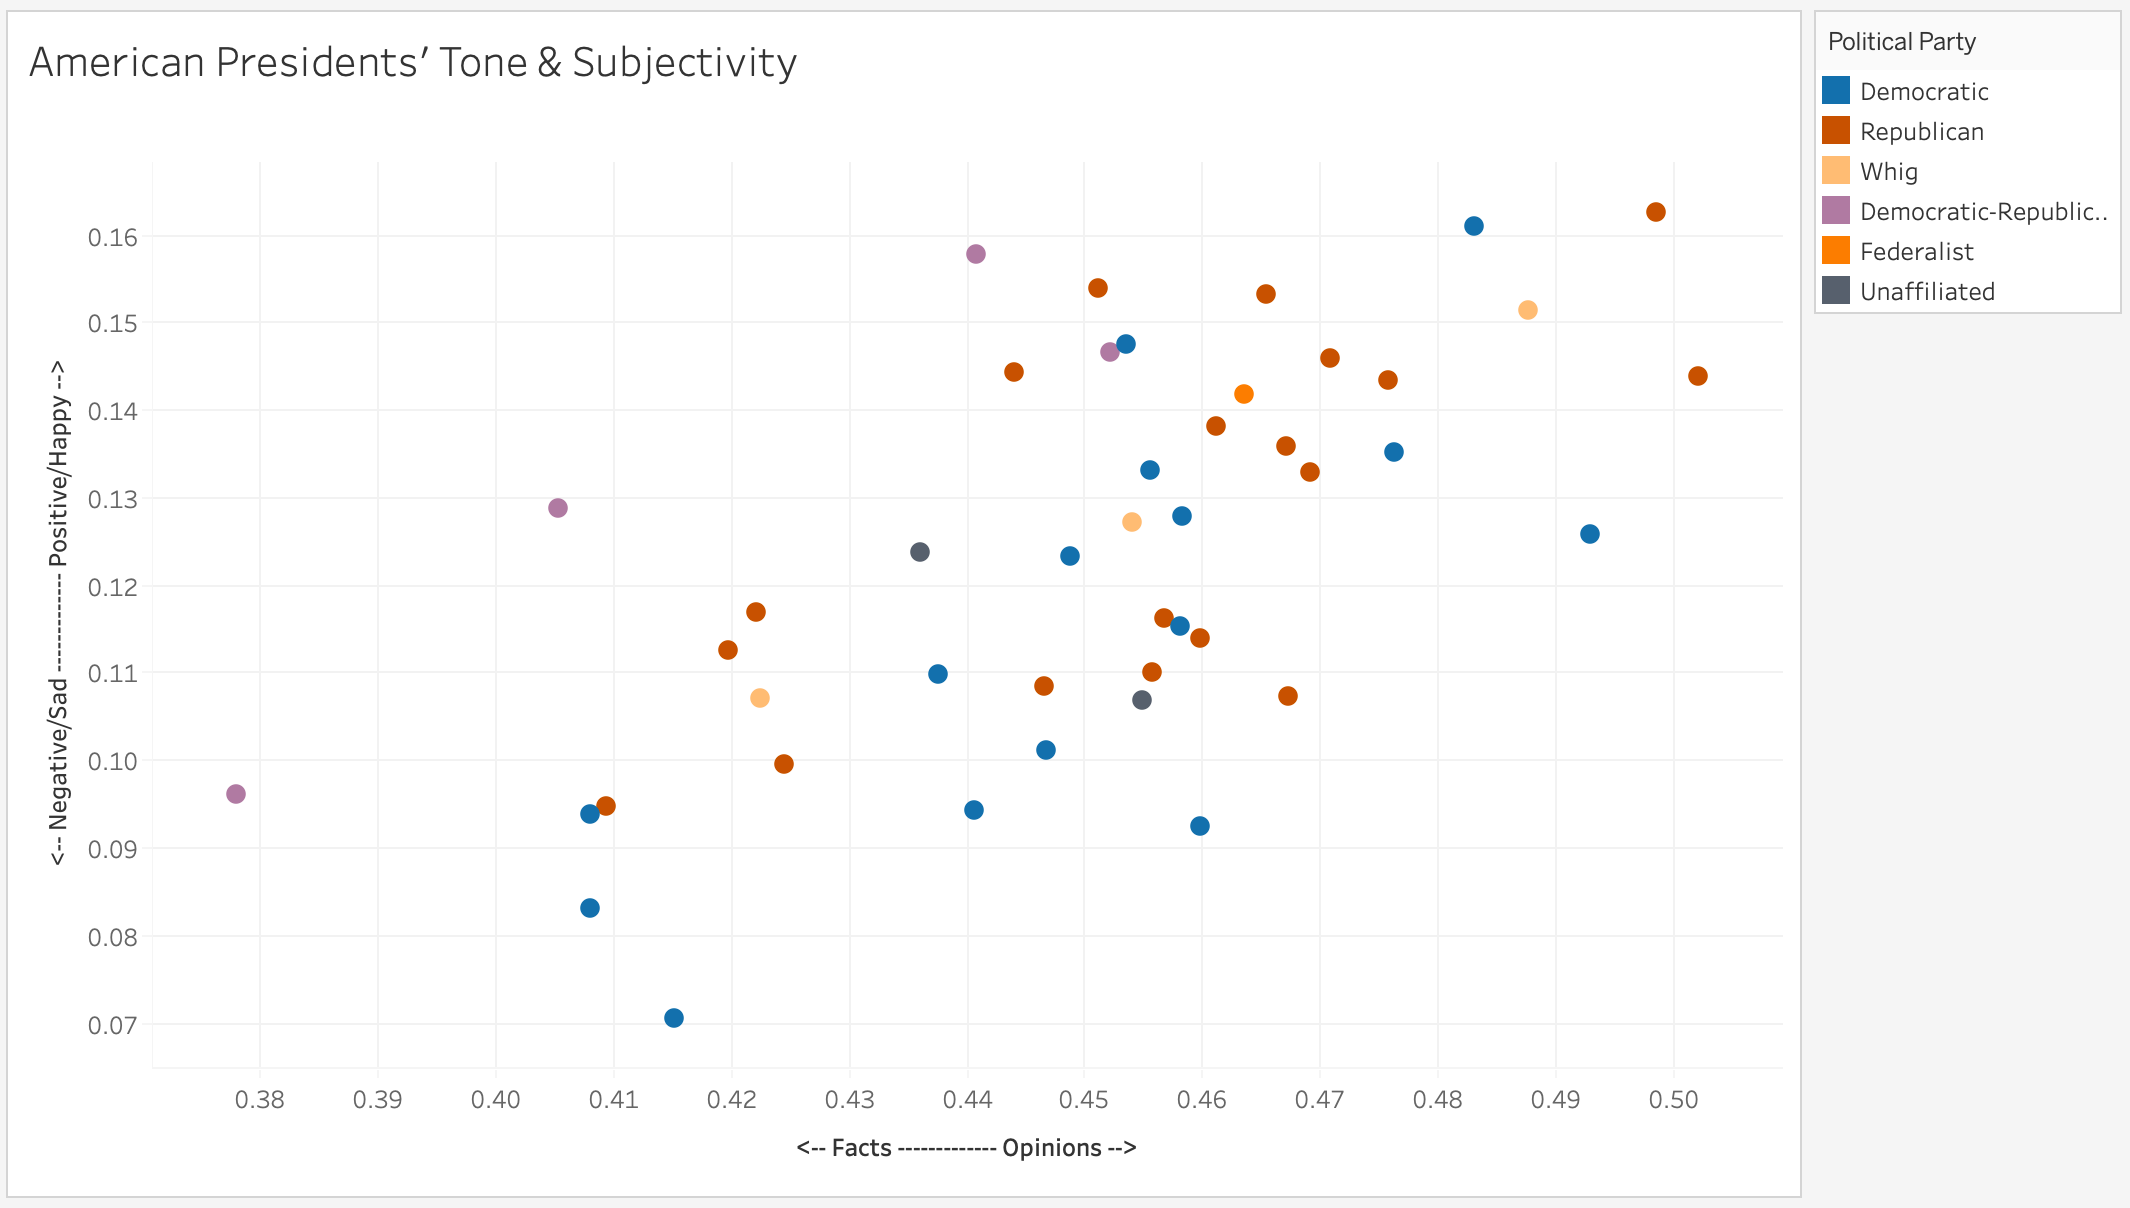
Screenshot by Author
As you can see in the graph, there are no strong clusters of colors, meaning there doesn’t seem to be a clear distinction of sentiment of Presidents by party — it seems to be more of a shift by individual.
Here you can see names of Republican Presidents >
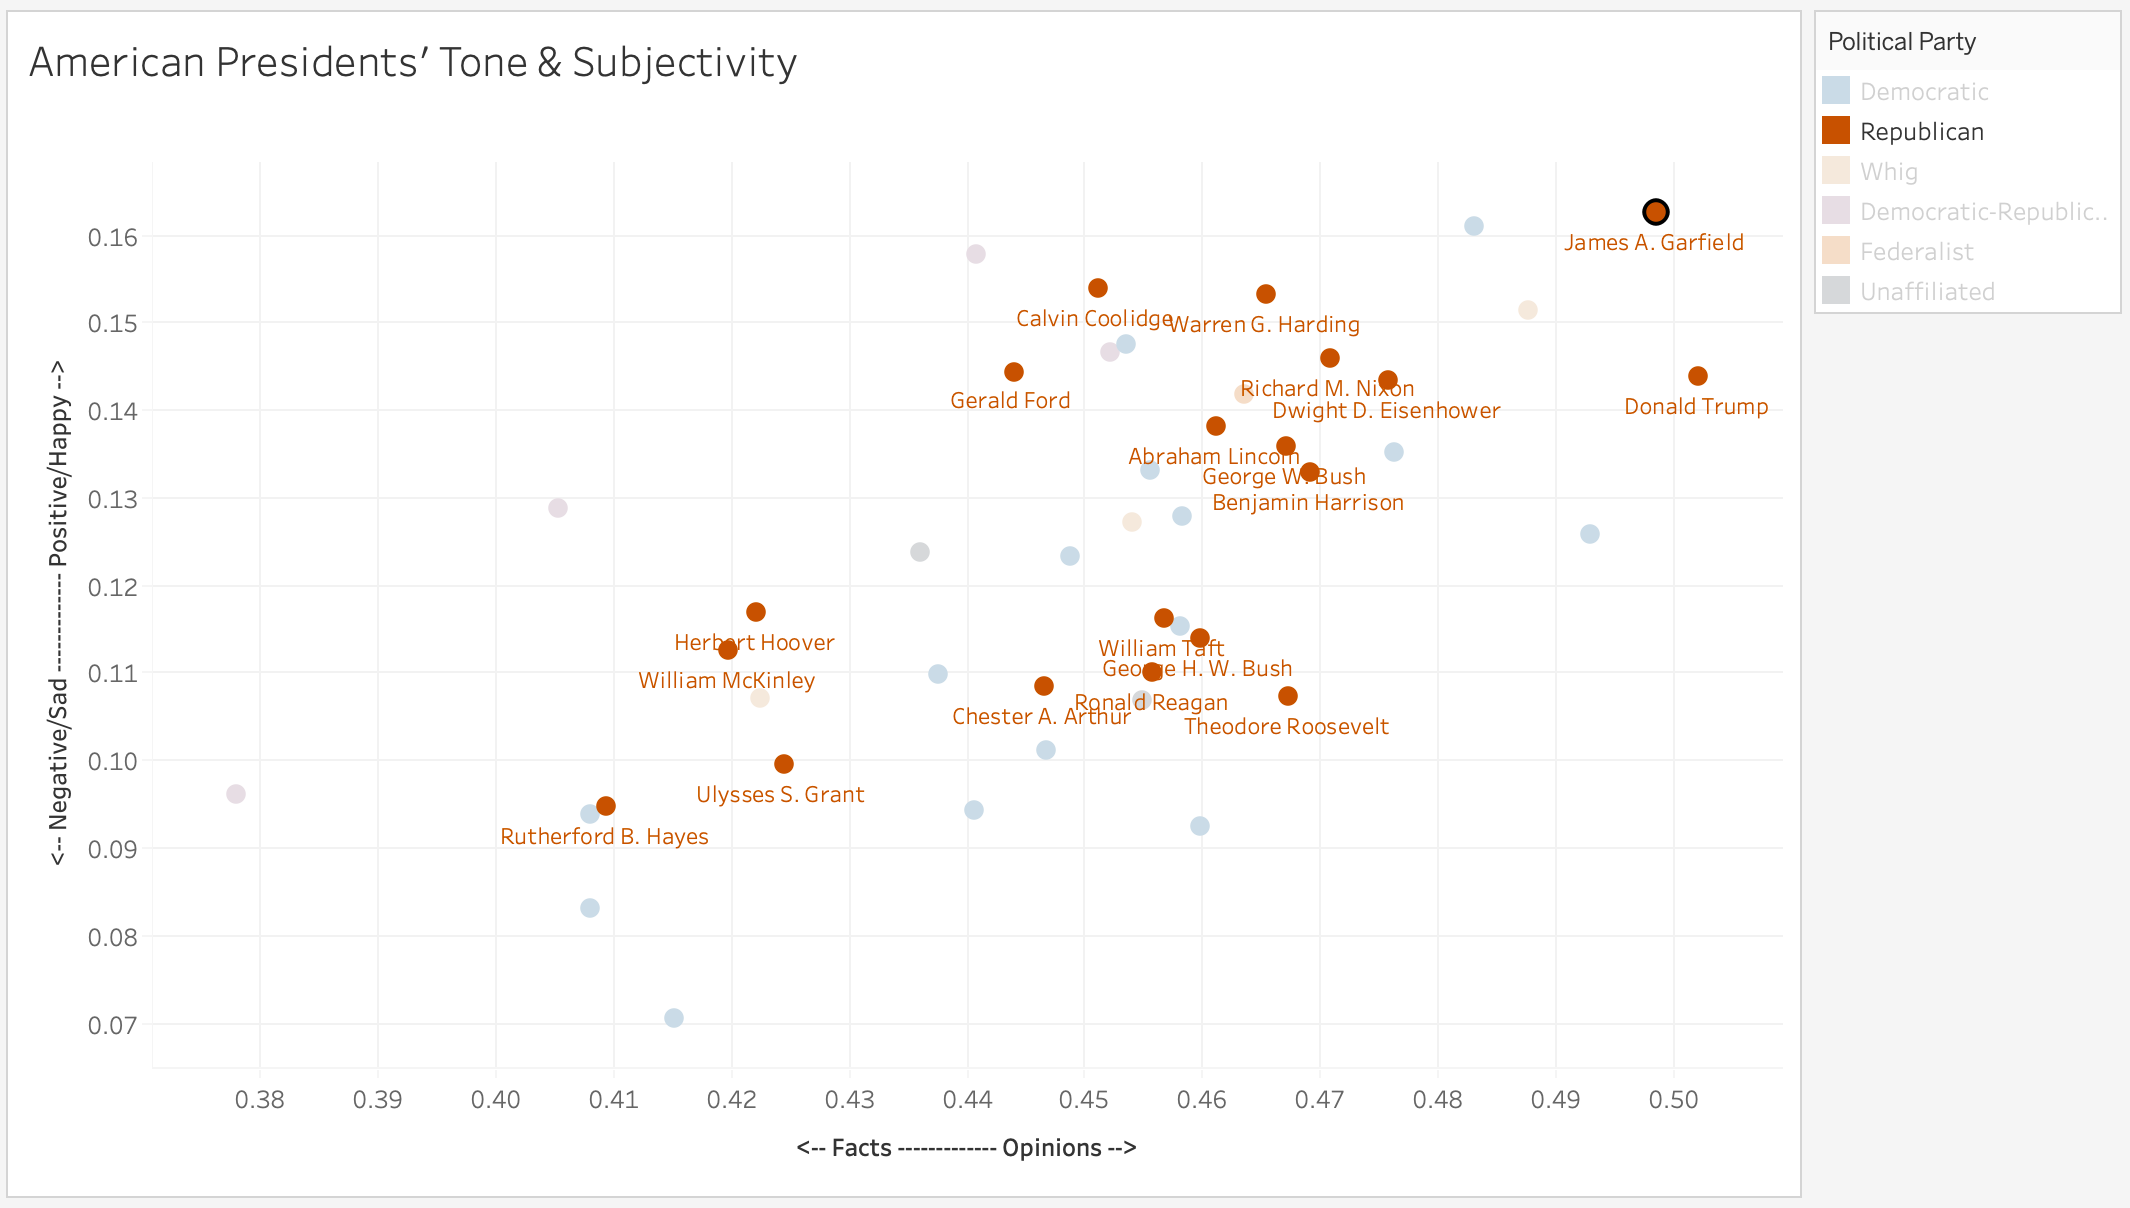
Screenshot by Author
And here you can see names of Democratic Presidents >
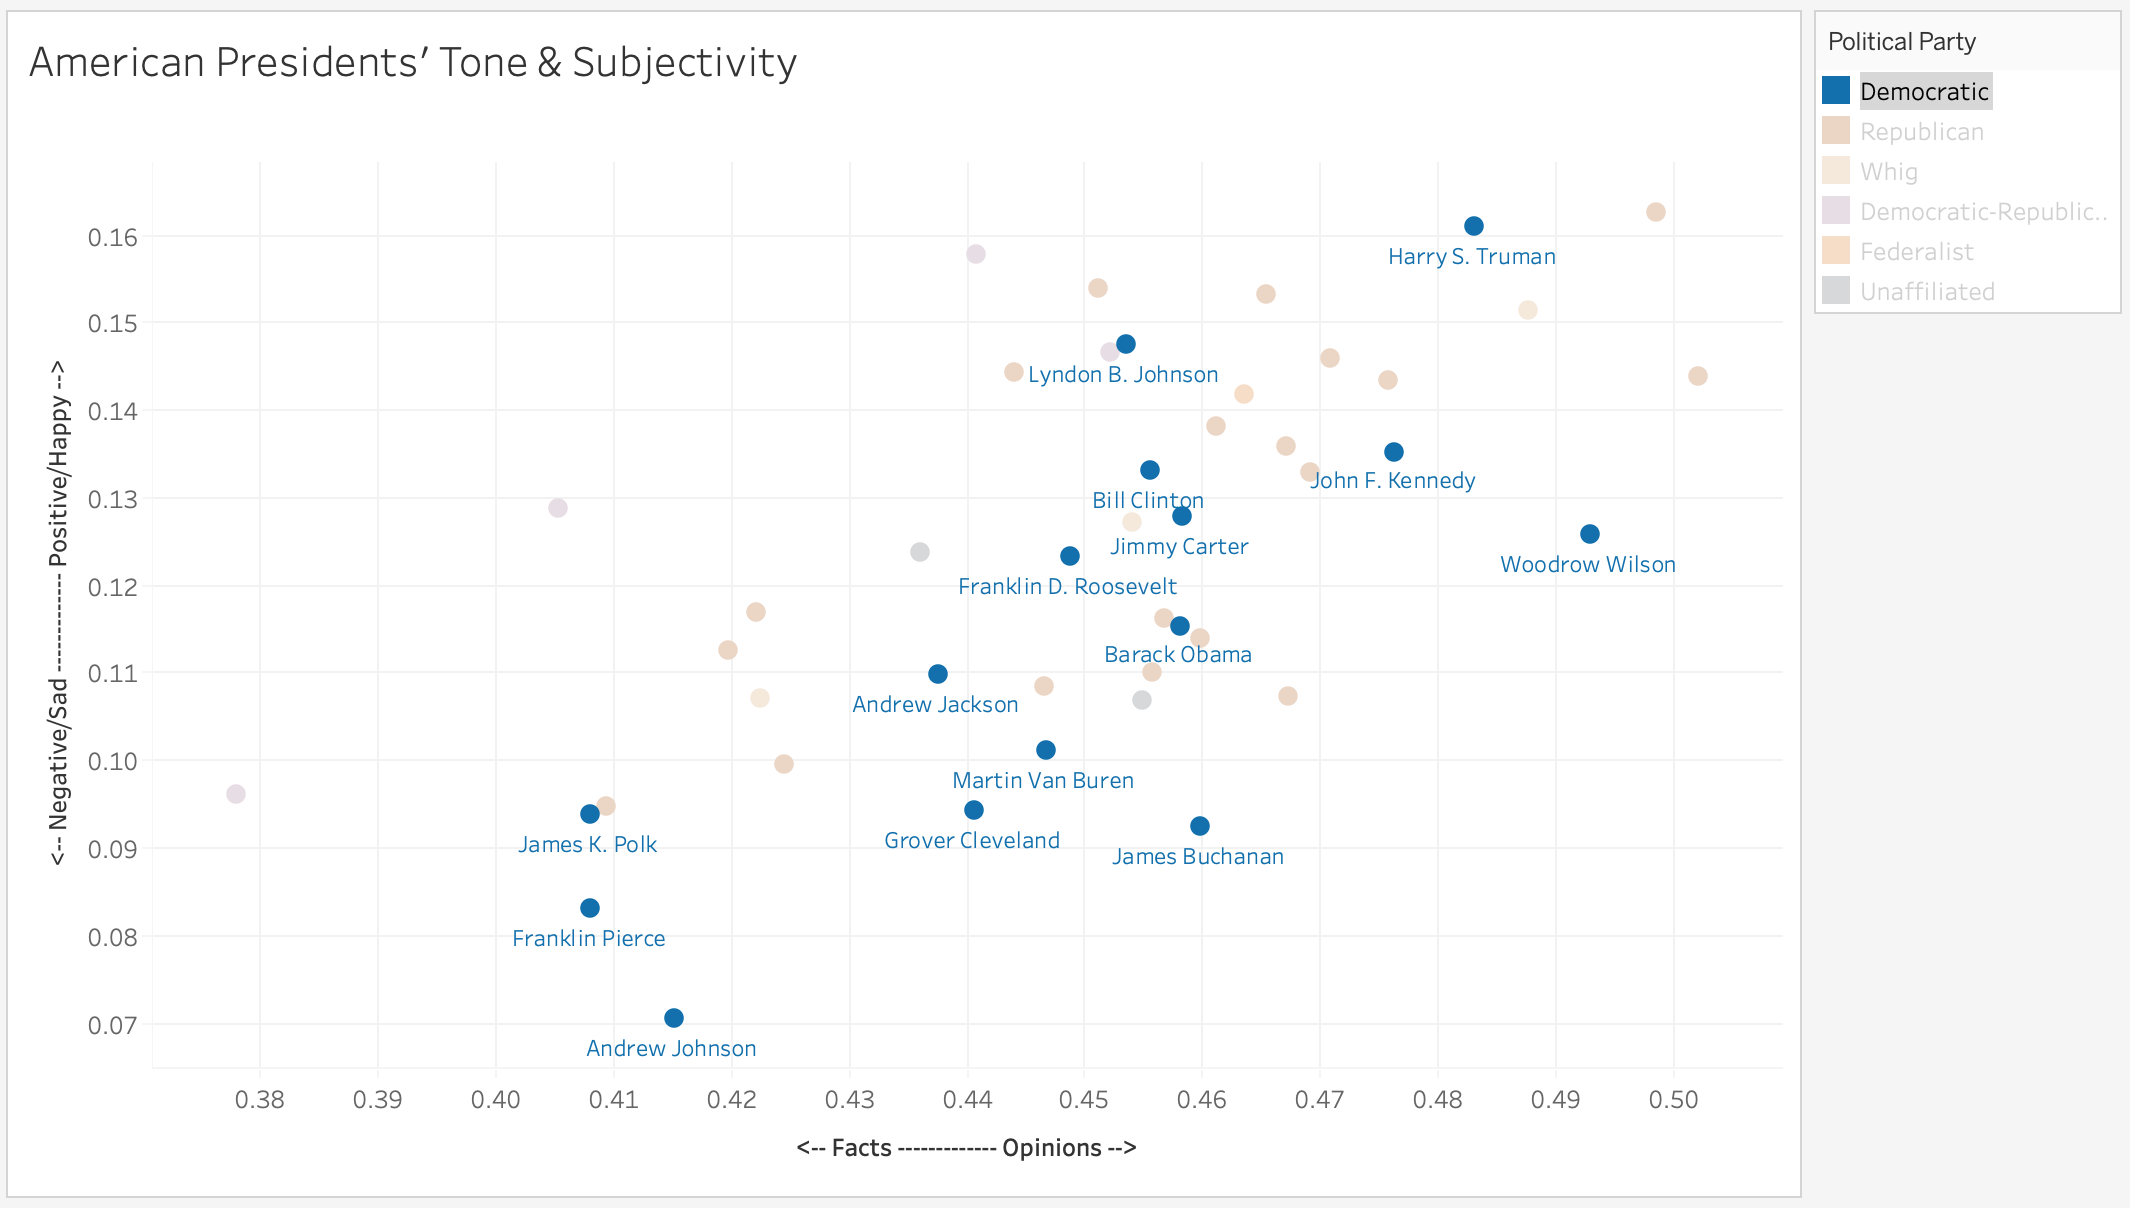
Screenshot by Author
From these graphs we can see for example that compared to other US Presidents, Franklin Pierce was on average more negative/sad in tone and more factual in content, while Donald Trump is on average more positive/happy in tone and more opinionated in content.
Keep in mind that polarity and subjectivity does not tell us what that President is saying; a President could be saying something positively but it could have negative impacts on people. This sentiment analysis only tells us how that President is delivering that content and whether they’re using facts or opinions to back their statements.
#elections #data-science #presidential-speeches #naturallanguageprocessing #us-president