Pre-requirements: Python 3, SQLite, SQLiteStudio (Optional), Quandl Account
Python modules required: Quandl, pandas, sqlite3, matplotlib, seaborn, numpy
This is a fairly straight forward solution, and is just illustrative of how simple ETL can be achieved with python and the various modules available. I have included some snippets of code to give an idea of how I have pieced it all together.
This of-course can be achieved with cloud platforms. However, for this project, I have opted to keep and manage my data locally. This also serves as an alternative to paying for cloud compute resources. Even if you can manage to get free compute and storage, most certainly for a limited period of time or limited capability. Running this locally will help me keep the project alive.
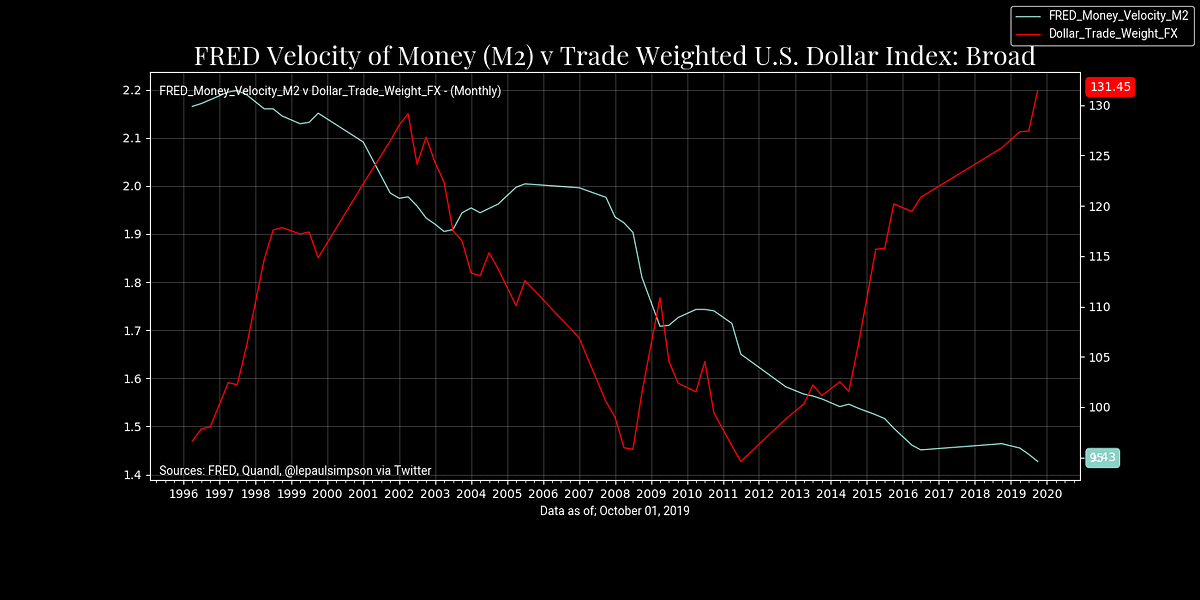
I will look at a range of data from Federal Reserve Economic Data (FRED) at federal reserve bank of St. Louis for economic research. Including data from Yale Department of Economics. All of which is derived from Quandl’s API.
The structure of my approach project is the following: by creating user defined functions to handle each stage; extract, transform, load, database query and charts.
The first step is to download and install SQLite on your local machine. Next step from this is to create a database. Optionally, you can create a database from the command line using SQLite commands or via SQLiteStudio. This will serve as database management.

SQLStudioLite
#matplotlib #economics #data-engineering #python #sqlite #programming
