It’s voting time. Get ready to see a million graphs showing poll results of all the various groups — how many left-handed cellists voted green party, how many fiscally liberal vampires want to defund global warming, how many otters publicly opinion that eating is best while lying on your back.
I used Chart.js to build a bar graph that displays poll results between three counters. In this blog, I’ll show you how I did it.

Tutorial
Table of Contents
- Preliminary Junk
- HTML & CSS
- JavaScript for Vote Buttons and Results Text
- Applying Chart.js
- Conclusion
Preliminary Junk
To start, I set up a file for my HTML, CSS, and JavaScript. Then, I installed Chart.js with npm:
npm install chart.js --save
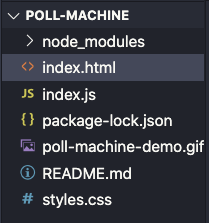
I ended up with a file structure (minus poll-machine-demo.gif) like this :
HTML & CSS
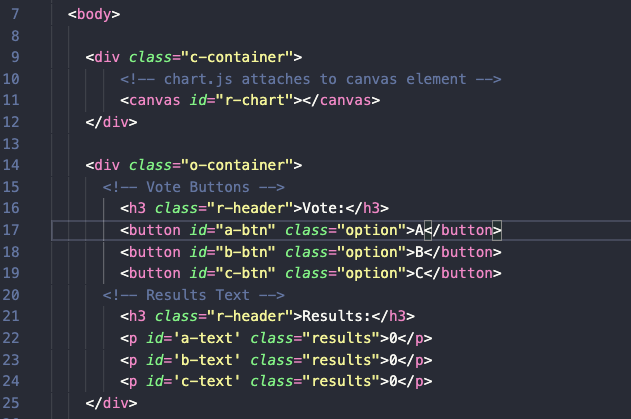
I set up the bones for this project in index.html.
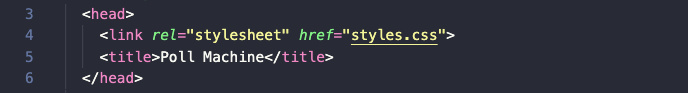
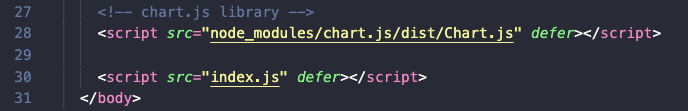
And of course, I connected my stylesheet, JavaScript file and the Chart.js node module.
#software-development #javascript #programming #chartjs #web-development