Create stunning visualizations for Pandas DataFrames
Exploratory data analysis is the foundation for understanding and building effective ML models. Data visualization is a key part of EDA, and there are many tools available for this. Bokeh is an interactive visualization library. It provides intuitive and versatile graphics. Bokeh can help to quickly and easily make interactive plots and dashboards. Pandas Bokeh provides a Bokeh plotting backend for Pandas.
Integrating Pandas Bokeh with your Python code is very simple. You only need to install and import the pandas-bokeh library, and then you can use it like any other visual tool. You should import Pandas-Bokeh library after importing Pandas. Use the following command to download and import pandas-bokeh library:
#Load the pandas_bokeh library

!pip install pandas_bokeh

import pandas as pd
import pandas_bokeh
You can set the plotting output as HTML or Notebook. To set the output to notebook use the command, pandas_bokeh.output_notebook(). This will embed the plot in the notebook cell. To display the output as a HTML file use the command, pandas_bokeh.output_file(filename).
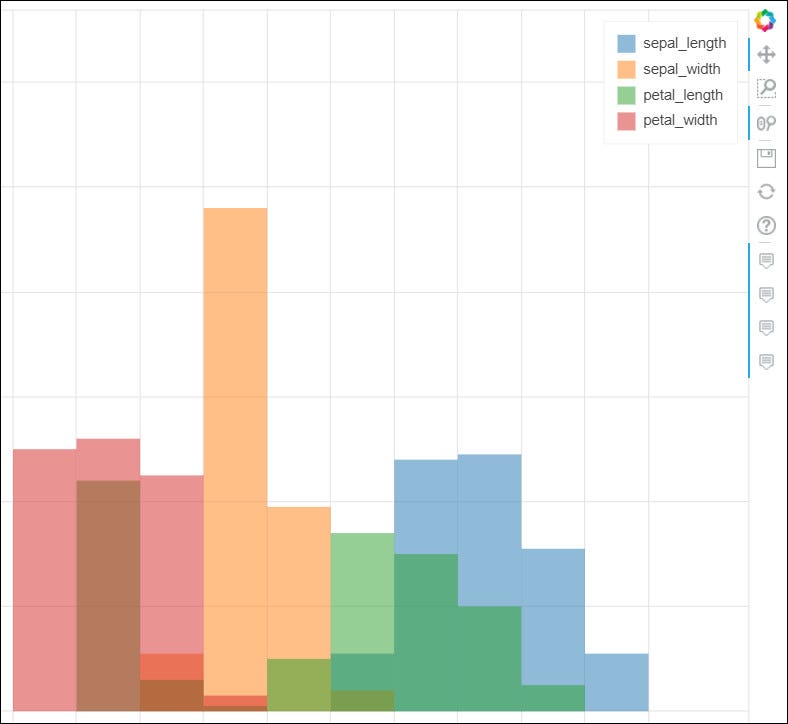
You can easily plot Pandas DataFrames using the command, df.plot_bokeh(). Pandas Bokeh offers a wide variety of plotting options such as line, scatter, bar, histogram, area, mapplot, step, point, and pie. All the plots are interactive, pannable, and zoomable. Here are some examples with the code of popular visualizations, plotted using pandas_bokeh that are commonly used in data analysis.
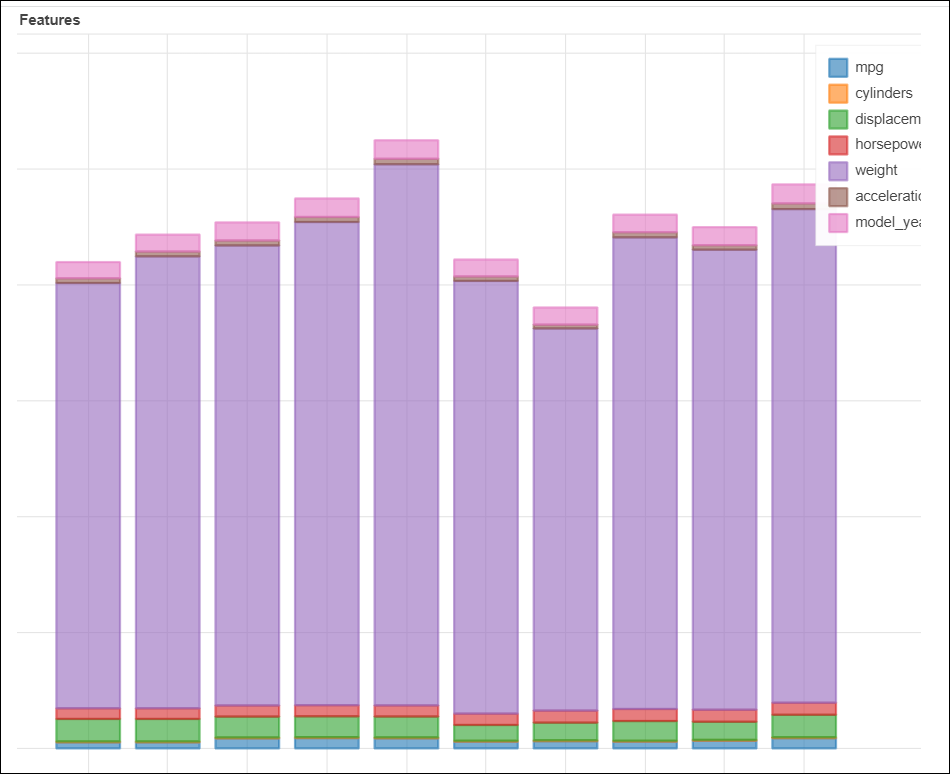
Bar Plot
#Vertical barchart
carhpbot.plot_bokeh(
    kind="bar",
    figsize =(1000,800),
    x="name",
    xlabel="Car Models",
    title="Bottom 10 Car Features",
    alpha=0.6,
    legend = "top_right",
    show_figure=True)

#Stacked vertical bar
carhpbot.plot_bokeh.bar(
    figsize =(1000,800),
    x="name",
    stacked=True,
    xlabel="Car Models",
    title="Bottom 10 Car Features",
    alpha=0.6,
    legend = "top_right",
    show_figure=True)
#data-visualization #exploratory-data-analysis #data-analysis #bokeh #pandas