A (long) while back I had the good fortune to take a hiking trip to the western part of Ireland, near Galway and through the Connemara National Park. The scenery was spectacular, but it was the ever-changing weather patterns that really caught my attention. It was not unusual for a single day of hiking to have multiple rain-sun cycles and many days had afternoon rainbows.
Located near the Atlantic Ocean, a warm stream of water arrives from the Gulf of Mexico and the Caribbean Sea. This makes the climate of Ireland milder than can be expected based on its latitude, and also limits extreme temperature swings year-round. But it rains, a lot, in Ireland.
To get an idea of the amount of rainfall in Ireland, I visited the web site of the Irish Meteorological Service (Met Éireann). They offer both current weather information and historical data. From the historical data page, I downloaded a dataset with time-series data for 1850–2010. This dataset includes rainfall for 25 stations across Ireland.
In this story, I will discuss how you can use this data and create a callable API that acts on this data to visualize it.
Each station has its own CSV file. Here is a sample for the station at University College, Galway:
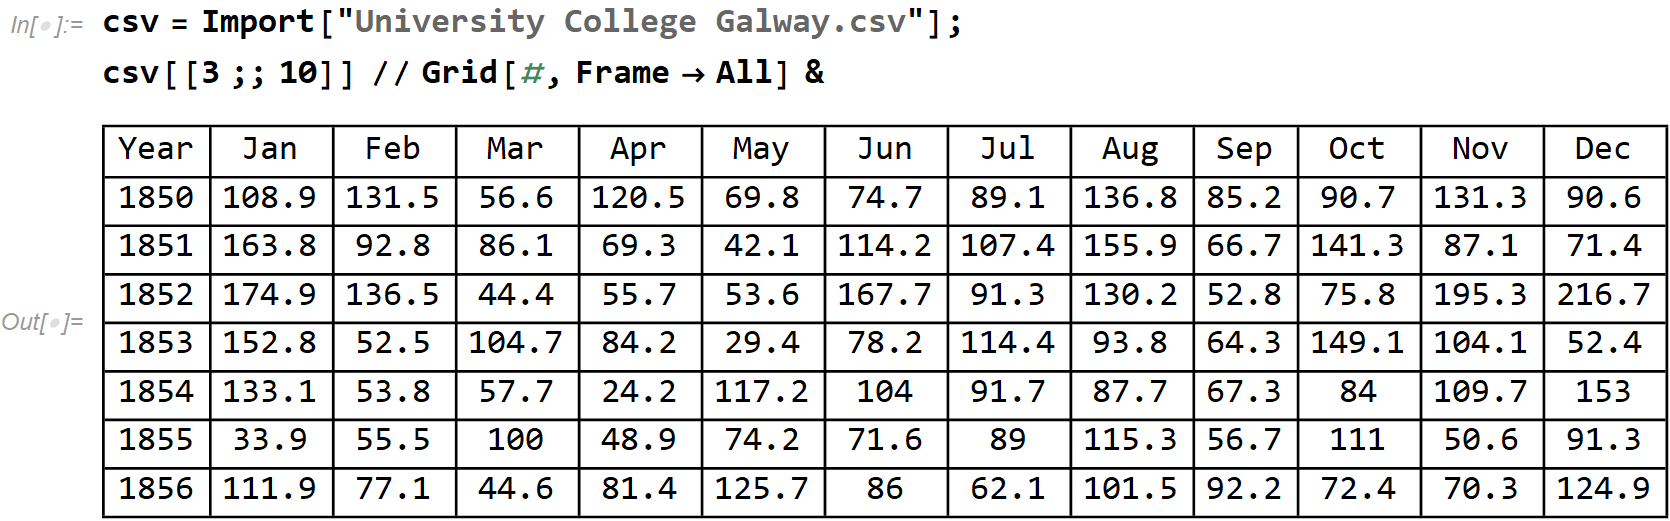
(image by author)
This raw data is best represented in the Wolfram Language with a TimeSeries object. We take the data fields from the **cvs **expression, generate the monthly dates with DateRange, and construct the **TimeSeries **(quick note: a notebook with complete code is provided at the end of this story):
rain = Flatten[csv[[4 ;;, 2 ;;]]];

dates = DateRange[
 DateObject[{1850, 1}, "Month"],
 DateObject[{2010, 12}, "Month"]];
ts = TimeSeries[Thread[{dates, rain}]]
#cloud-services #data-science #wolfram #computational-thinking #api-development