What is the Class Imbalance Problem?
D
ata are said to suffer the Class Imbalance Problem when the class distributions are highly imbalanced. This is a scenario where the number of observations belonging to one class is significantly lower than those belonging to the other classes. Machine Learning algorithms tend to produce unacceptable predictions when faced with imbalanced datasets.
Here in this article, we will see some of the techniques on how to handle the Class Imbalance Problem using R.
Let’s take data where the dependant variable is admission into college based on the independent variables such as GRE score, GPA score, and the ranking of the school.
Below is the structure of the data.

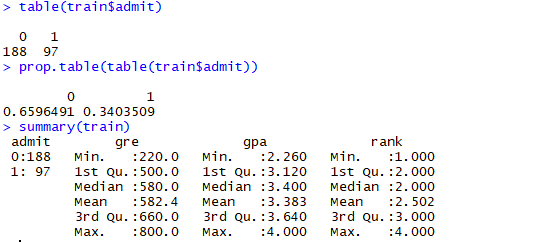
Let’s convert the type of the target variable as a factor. The summary of the data shows the imbalance of the target variable.


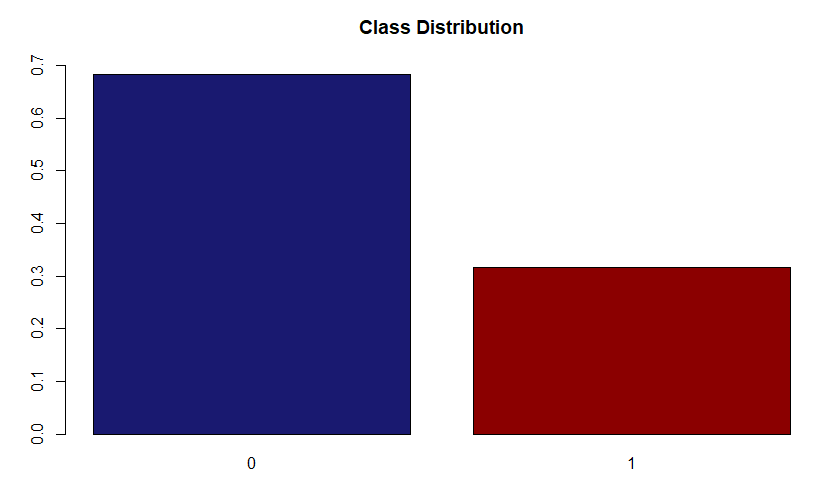
In our data, about two-thirds of the data belongs ‘0’ category.
Thus, we can say there is a class imbalance.
So when we develop a prediction model on such data, the model will be dominated by the contribution of class ‘0’. Accuracy of the model will be better when predicting the not admitted class than admitted class. But they may be a scenario where we would be interested in predicting the admitted class more accurately. So this is called the Class Imbalance Problem.
Data Partition
Now let’s partition the data into train and test data in the ratio of 70:30.


Test data has 115 observations and train data has 285 observations
Below is the distribution of the target variable in training data. Around 66% of the data belong to not admitted class.

Prediction Model
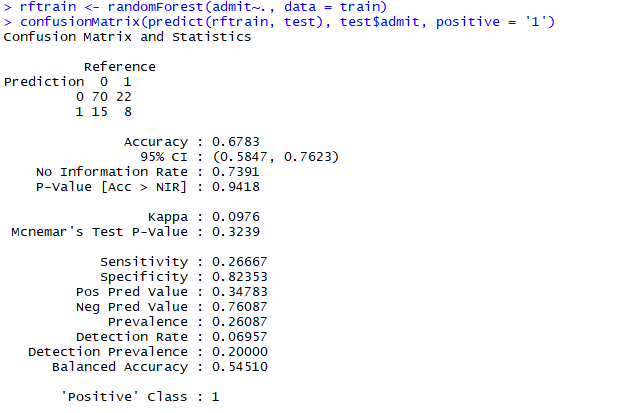
Let’s develop a prediction model using the Random Forest algorithm and the corresponding confusion matrix on test data.

Here we can see the accuracy of the model is 67.83%. The model has correctly classified 70 students as not admitted and 8 students as admitted. The 95% confidence interval indicates that the accuracy lies between 58.47% and 76.23%.
‘No Information Rate’ indicates the largest proportion of the observed class. In this dataset, the largest proportion((70+15)/115=73.91%) belongs to the ‘0’ class. It means if we do not build any model and plainly classify every applicant not accepted, it will be correct 73.9% of the time. Also, the overall accuracy of the model is lesser than the No Information Rate. Thus the model is not good.
Also, if we are interested in predicting 1, then this model will not be sufficient.
#rstudio #machine-learning #data-science #imbalanced-data #feature-engineering #data analysisa
