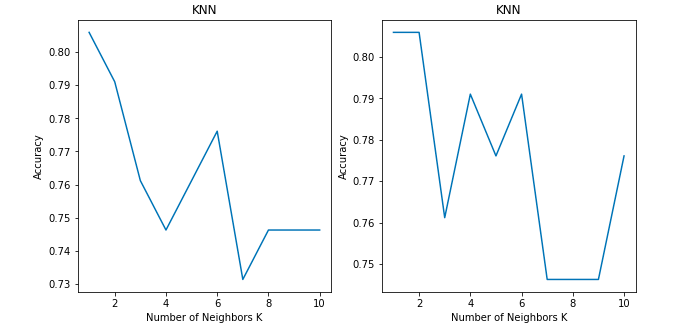
Did you find any difference between the two graphs?
Both show the accuracy of a classification problem for K values between 1 to 10.
Both of the graphs use the KNN classifier model with ‘Brute-force’ algorithm and ‘Euclidean’ distance metric on same dataset. Then why is there a difference in the accuracy between the two graphs?
Before answering that question, let me just walk you through the KNN algorithm pseudo code.
I hope all are familiar with k-nearest neighbour algorithm. If not, you can read the basics about it at https://www.analyticsvidhya.com/blog/2018/03/introduction-k-neighbours-algorithm-clustering/.
We can implement a KNN model by following the below steps:
- Load the data
- Initialise the value of k
- For getting the predicted class, iterate from 1 to total number of training data points
- Calculate the distance between test data and each row of training data. Here we will use Euclidean distance as our distance metric since it’s the most popular method. Some of the other metrics that can be used are Chebyshev, cosine, etc.
- Sort the calculated distances in ascending order based on distance values
- Get top k rows from the sorted array
- Get the most frequent class of these rows
- Return the predicted class
#2020 oct tutorials # overviews #algorithms #k-nearest neighbors #machine learning #python