This is the first post in the series: Visualizing ASP.NET Core 3.0 endpoints using GraphvizOnline.
- Part 1 - Visualizing endpoints using the DOT language (this post)
- Part 2 - Adding an endpoint graph to your ASP.NET Core application
- Part 3 - Creating a custom DfaGraphWriter using ImpromptuInterface for easier reflection
- Part 4 - Creating a custom endpoint visualization graph
- Part 5 - Detecting duplicate routes in ASP.NET Core
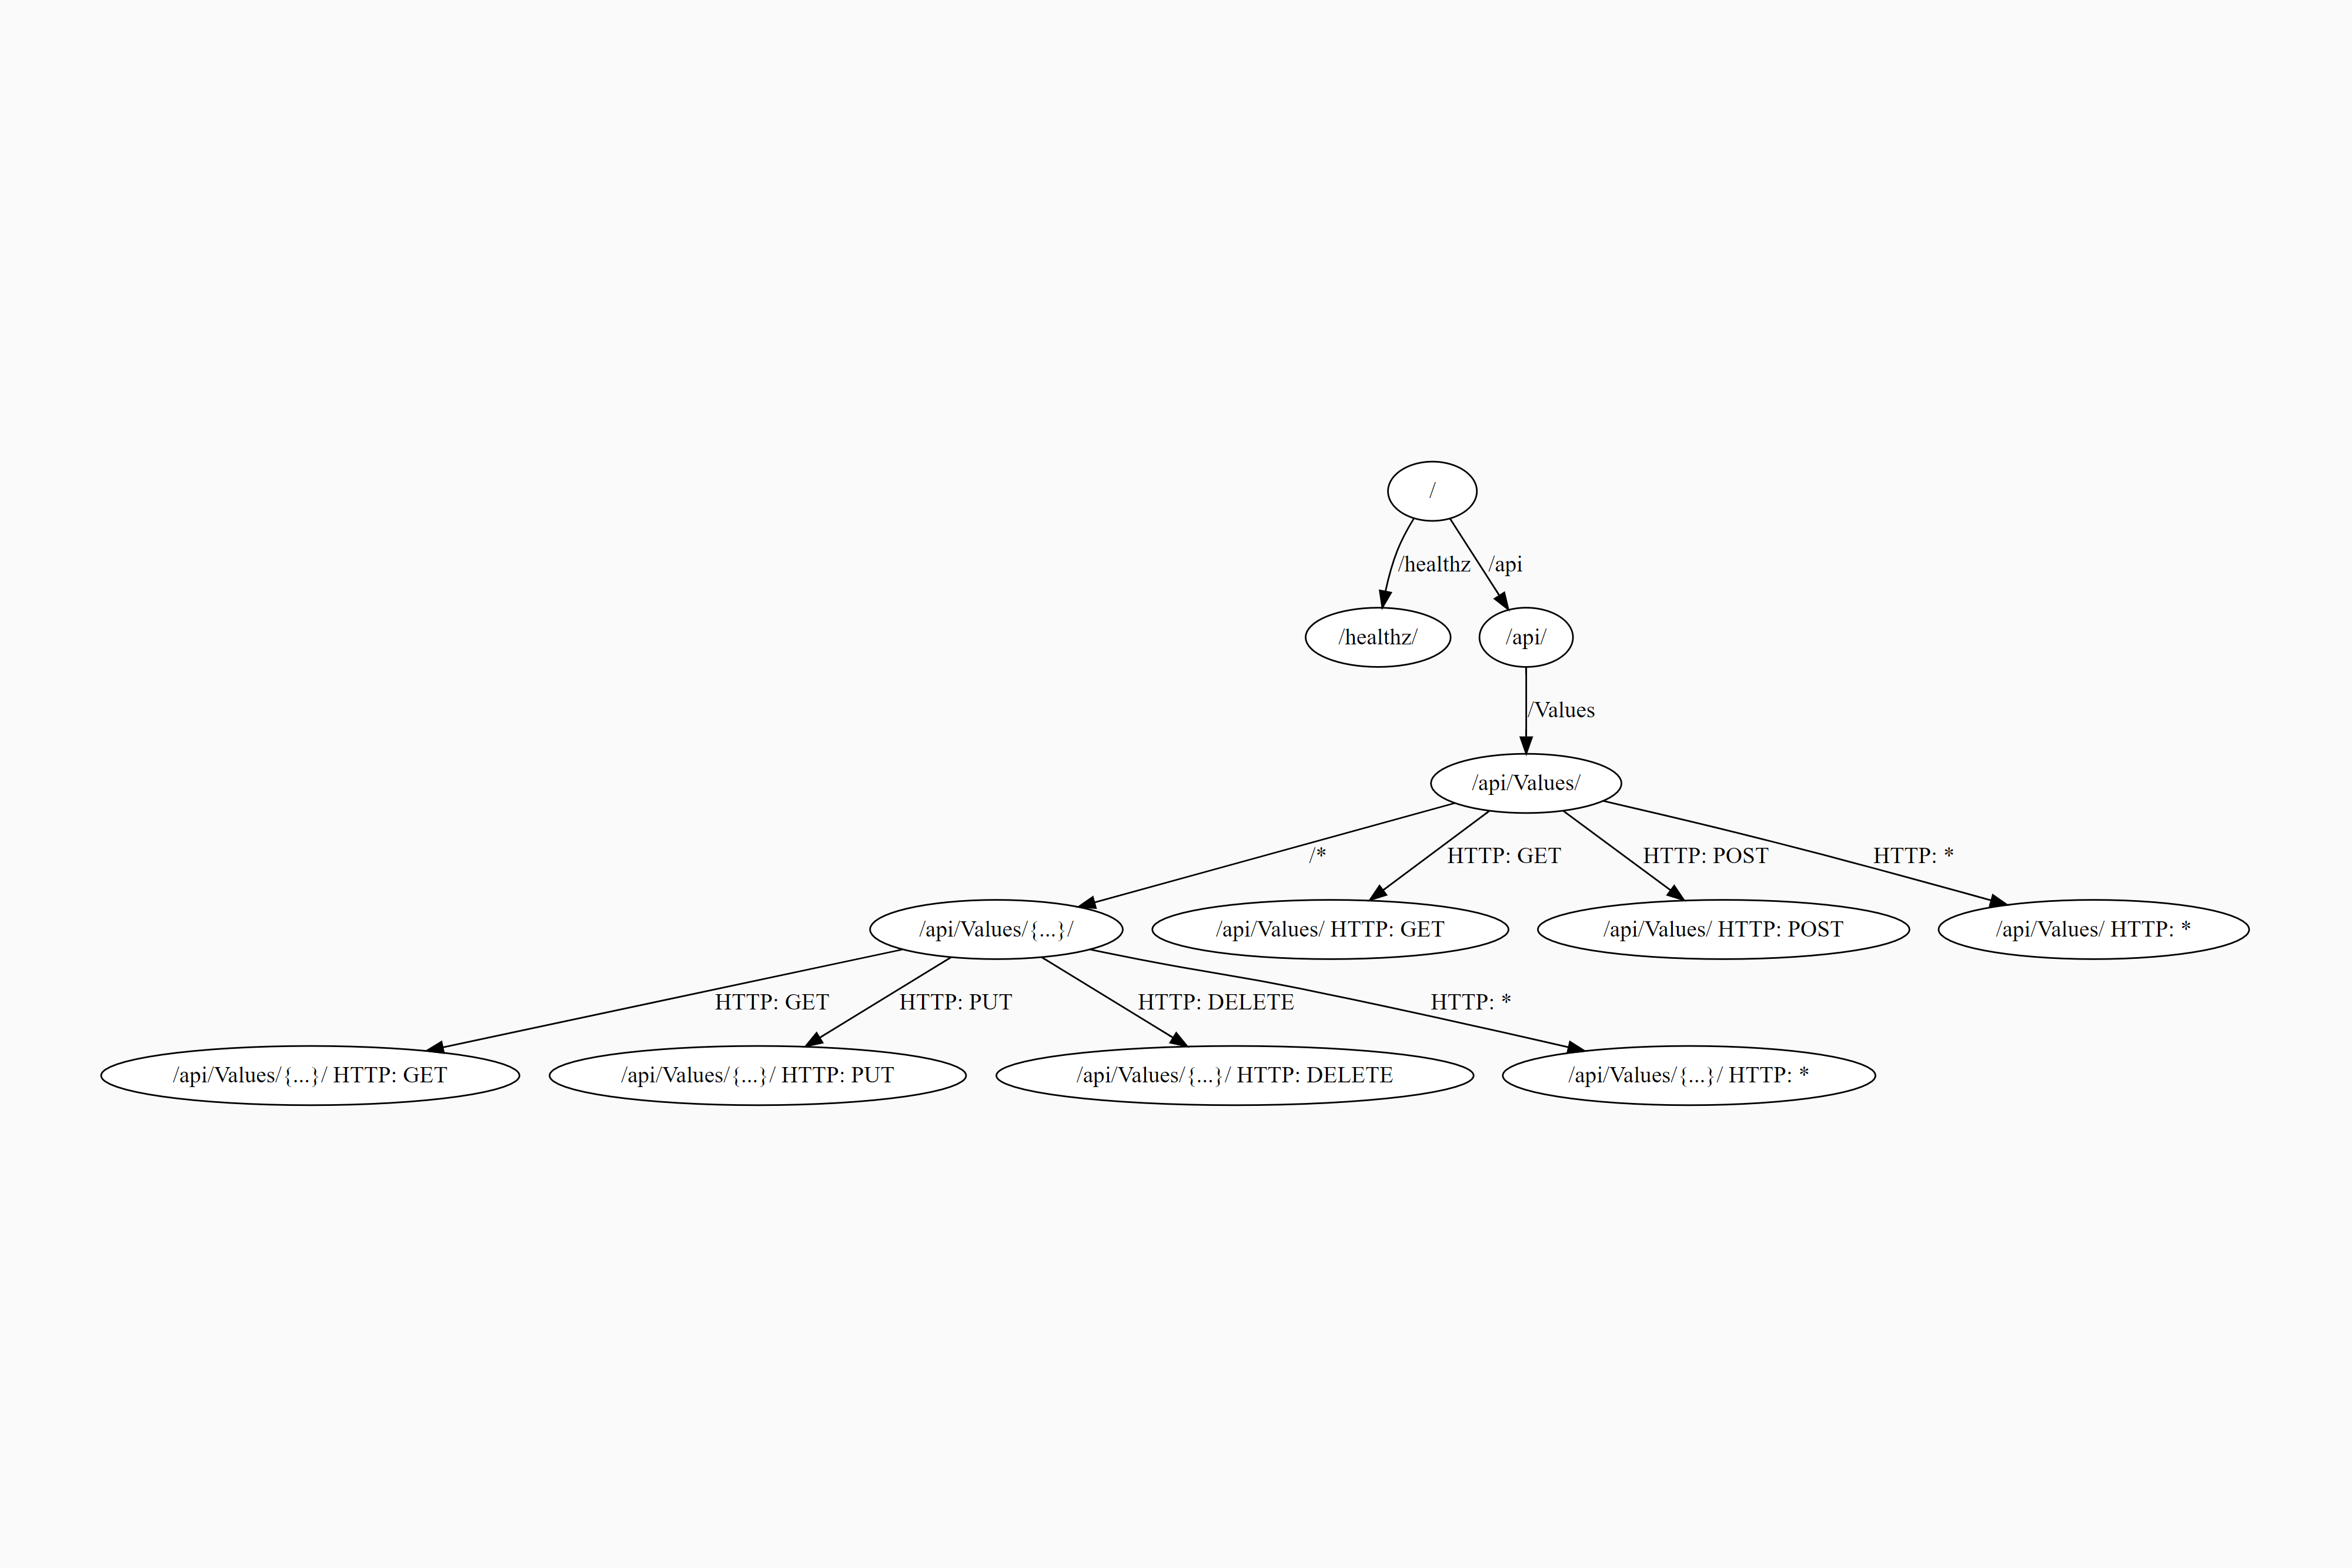
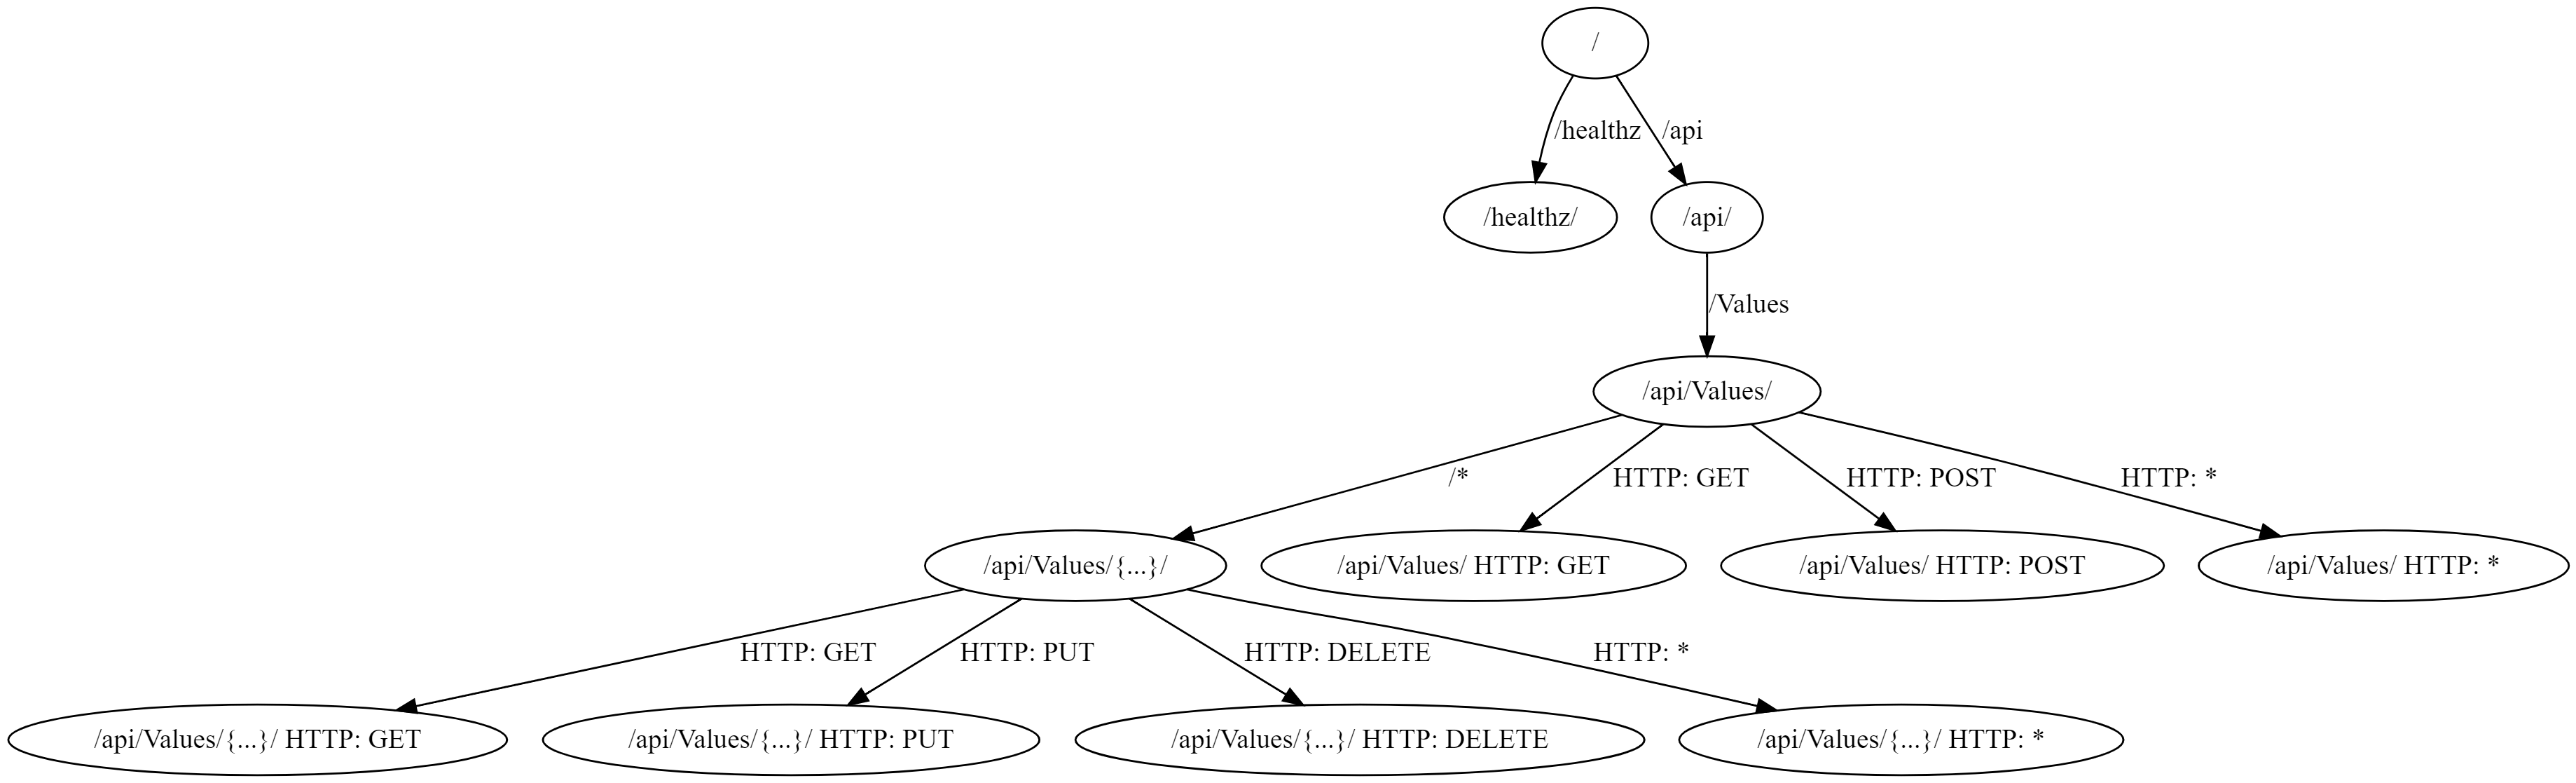
In this post I show how the endpoint routes in an ASP.NET Core 3.0 application can be visualized using the GraphvizOnline service. That lets you create diagrams like the following, which describe all the endpoints in your application:
Drawing graphs with GraphvizOnline and the DOT language
GraphvizOnline is a GitHub project that provides an online vizualizer for viewing graphs specified in the DOT graph description language. This is a simple language that lets you define various types of graph, which connects nodes with edges.
For example, a basic undirected graph could be defined as
graph MyGraph {
  a -- b -- c;
  b -- d;
}
which describes the following graph:
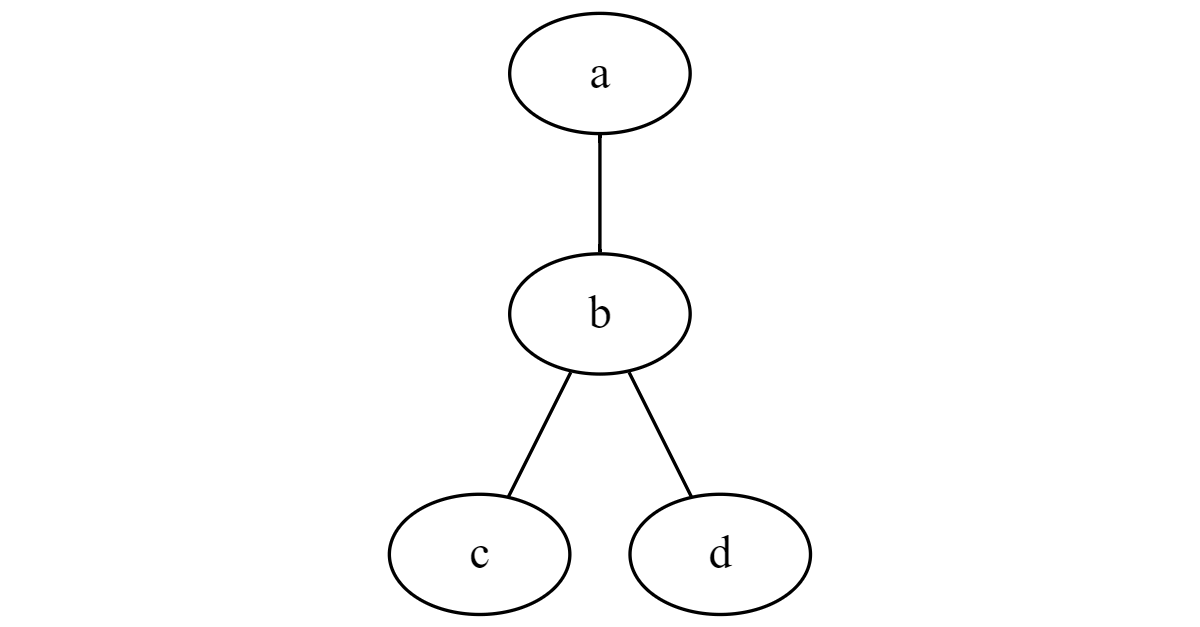
Each node has a name (a, b, c, d), and -- defines the edges between the nodes. The edges define connections between nodes, but they don’t have a direction (hence the name, undirected).
You can also define a directed graph, in which the edges do have a direction. For a directed edge use -> instead of --. For example:
digraph MyGraph {
  a -> b -> c;
  d -> b;
}
#asp.net core #routing