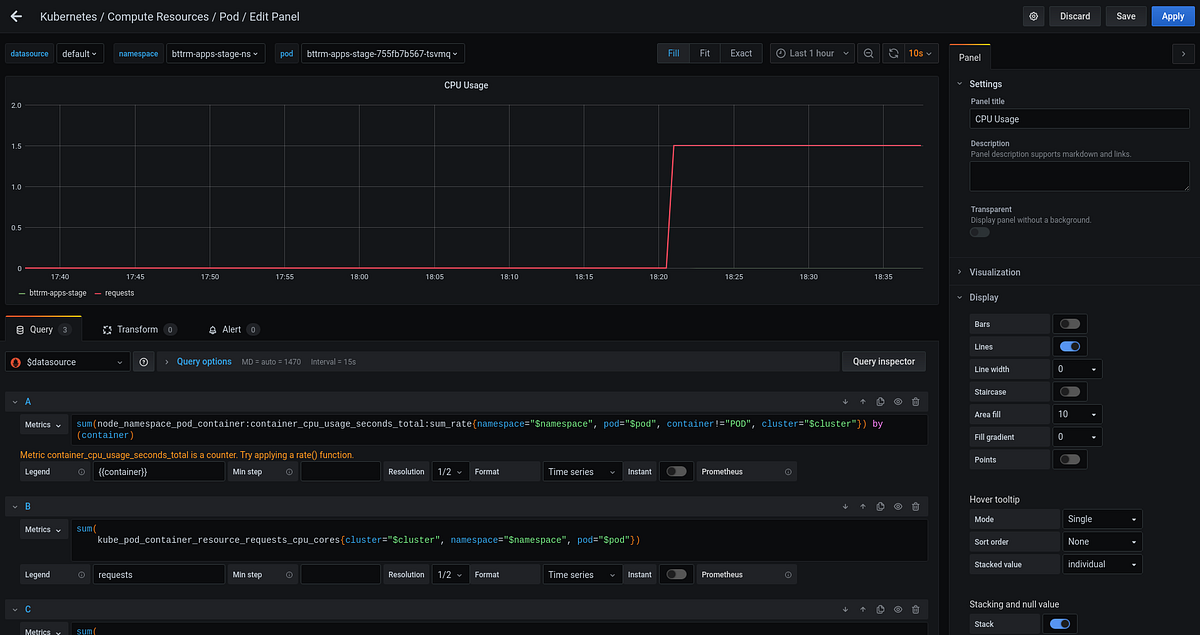
Continuing with the Kubernetes: monitoring with Prometheus — exporters, a Service Discovery, and its roles, where we configured Prometheus manually to see how it’s working — now, let’s try to use Prometheus Operator installed via Helm chart.
So, the task is spin up a Prometheus server and all necessary exporter in an AWS Elastic Kubernetes Cluster and then via [/federation](https://rtfm.co.ua/prometehus-obzor-federation-monitoring-docker-swarm-i-nastrojki-alertmanager/#Prometheus_crossservice_federation) pass metrics to our “central” Prometheus server with Alertmanager alerts and Grafana dashboards.
A bit confusing is the whole set of such Helm charts — there is a “simple” Prometheus chart, and kube-prometheus, and prometheus-operator:
- Bitnami Prometheus Operator — https://github.com/bitnami/charts/tree/master/bitnami/prometheus-operator/
- CoreOS Prometheus Operator — https://github.com/coreos/prometheus-operator
- Helm Community Prometheus Operator — https://github.com/helm/charts/tree/master/stable/prometheus-operator
- CoreOS
kube-prometheus- https://github.com/coreos/kube-prometheus - And “just a Prometheus” — https://github.com/helm/charts/tree/master/stable/prometheus
Although if look for it via helm search — it returns the only one prometheus-operator:
$ helm search repo stable/prometheus-operator -o yaml
- app_version: 0.38.1
description: Provides easy monitoring definitions for Kubernetes services, and deployment
and management of Prometheus instances.
name: stable/prometheus-operator
version: 8.14.0
The difference between stable/prometheus and stable/prometheus-operator is that Operator has built-in Grafana with a set of ready for use dashboards and set of ServiceMonitors to collect metrics from a cluster’s services such as the CoreDNS, API Server, Scheduler, etc.
So, as mentioned — we will use the [stable/prometheus-operator](https://github.com/helm/charts/tree/master/stable/prometheus-operator).
Content
- Prometheus Operator deployment
- Grafana access
- Prometheus Operator configuration
- Adding new application under monitoring
- Redis server launch
- redis_exporter launch
- Adding Kubernetes ServiceMonitor
- Prometheus Operator Helm deployment and its services configuration
- An AWS LoadBalancer configuration
Prometheus Operator deployment
Deploy it with Helm:
$ helm install — namespace monitoring — create-namespace prometheus stable/prometheus-operator
manifest_sorter.go:192: info: skipping unknown hook: “crd-install”
manifest_sorter.go:192: info: skipping unknown hook: “crd-install”
manifest_sorter.go:192: info: skipping unknown hook: “crd-install”
manifest_sorter.go:192: info: skipping unknown hook: “crd-install”
manifest_sorter.go:192: info: skipping unknown hook: “crd-install”
manifest_sorter.go:192: info: skipping unknown hook: “crd-install”
NAME: prometheus
LAST DEPLOYED: Mon Jun 15 17:54:27 2020
NAMESPACE: monitoring
STATUS: deployed
REVISION: 1
NOTES:
The Prometheus Operator has been installed. Check its status by running:
kubectl — namespace monitoring get pods -l “release=prometheus”
Visit https://github.com/coreos/prometheus-operator for instructions on how to create & configure Alertmanager and Prometheus instances using the Operator.
Check pods:
$ kk -n monitoring get pod
NAME READY STATUS RESTARTS AGE
alertmanager-prometheus-prometheus-oper-alertmanager-0 2/2 Running 0 41s
prometheus-grafana-85c9fbc85c-ll58c 2/2 Running 0 46s
prometheus-kube-state-metrics-66d969ff69–6b7t8 1/1 Running 0 46s
prometheus-prometheus-node-exporter-89mf4 1/1 Running 0 46s
prometheus-prometheus-node-exporter-bpn67 1/1 Running 0 46s
prometheus-prometheus-node-exporter-l9wjm 1/1 Running 0 46s
prometheus-prometheus-node-exporter-zk4cm 1/1 Running 0 46s
prometheus-prometheus-oper-operator-7d5f8ff449-fl6x4 2/2 Running 0 46s
prometheus-prometheus-prometheus-oper-prometheus-0 3/3 Running 1 31
_Note: __alias kk="kubectl" >> ~/.bashrc_
So, the Prometheus Operator’s Helm chart created a whole bunch of services — Prometheus itself, Alertmanager, Grafana, plus a set of ServiceMonitors:
$ kk -n monitoring get servicemonitor
NAME AGE
prometheus-prometheus-oper-alertmanager 3m53s
prometheus-prometheus-oper-apiserver 3m53s
prometheus-prometheus-oper-coredns 3m53s
prometheus-prometheus-oper-grafana 3m53s
prometheus-prometheus-oper-kube-controller-manager 3m53s
prometheus-prometheus-oper-kube-etcd 3m53s
prometheus-prometheus-oper-kube-proxy 3m53s
prometheus-prometheus-oper-kube-scheduler 3m53s
prometheus-prometheus-oper-kube-state-metrics 3m53s
prometheus-prometheus-oper-kubelet 3m53s
prometheus-prometheus-oper-node-exporter 3m53s
prometheus-prometheus-oper-operator 3m53s
prometheus-prometheus-oper-prometheus 3m53s
The ServiceMonitors role will be reviewd in this post later in the Добавление сервиса в мониторинг part.
#monitoring #kubernetes #grafana #prometheus
