Debug for Angular 8 Application with VS code
I have seen many developers still use developer tools and Chrome console to debug their web applications. Visual Studio Code have a very powerful inbuilt debug option available for debugging. In this post, I will explain all the simple steps for debugging an Angular application.
Install Debugger for Chrome extension in Visual Studio Code
Open Extension menu in Visual Studio Code.
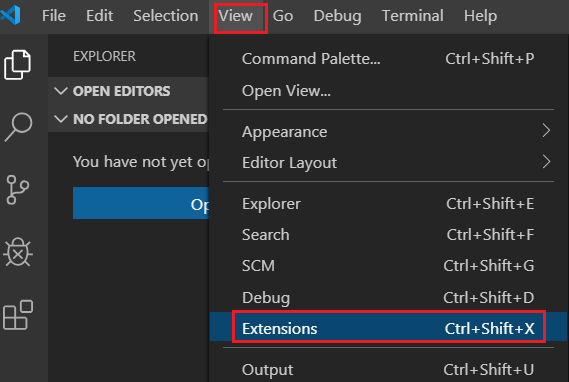
Search for “Debugger for Chrome” and install the extension.
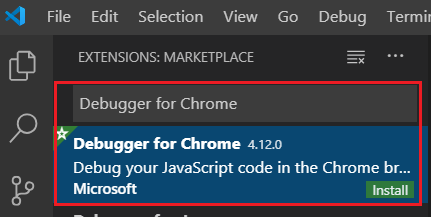
This extension is provided by Microsoft
Create a new Angular 8 application using CLI
We can create a new Angular application using CLI
ng new AngularDebugger
After some time, all the node packages will be created successfully. Open the application in Visual Studio Code.
We can modify the default template of App component by below code.
app.component.html
<button (click)="clickButton()" type="button">Click Here!</button>
We can modify the class file also with below code.
app.component.ts
import { Component } from '@angular/core';

@Component({
  selector: 'app-root',
  templateUrl: './app.component.html',
  styleUrls: ['./app.component.css']
})
export class AppComponent {

  clickButton() {
    let num = 10;
    num++;
    alert(`Value of 'num' is : ${num}`);
  }
}
You can see a “Debug” button in the left side bar of visual studio code. Please click that button.
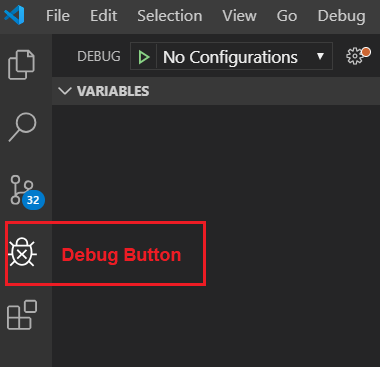
We can create a new configuration file for Debug by clicking “Add Configuration”
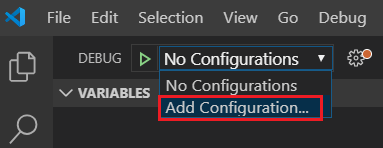
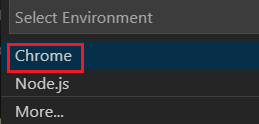
Select Chrome as environment
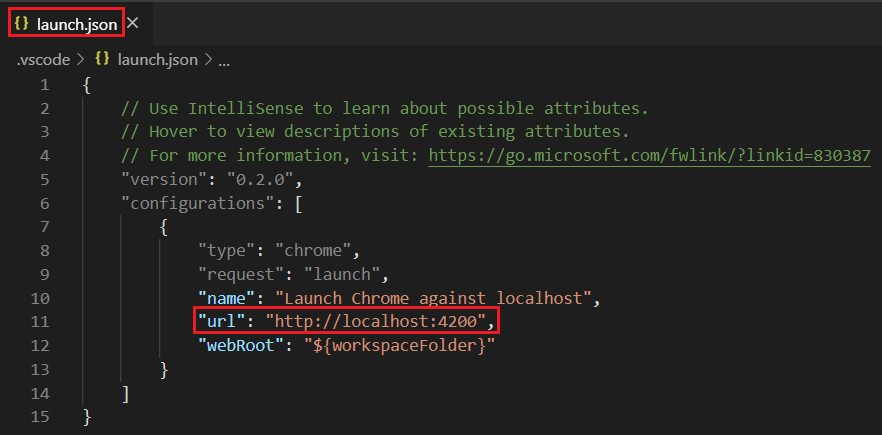
It will automatically create a new “launch.json” file. You can modify the default port number in “url” section of this file to “4200”. By default, Angular is running in this port.
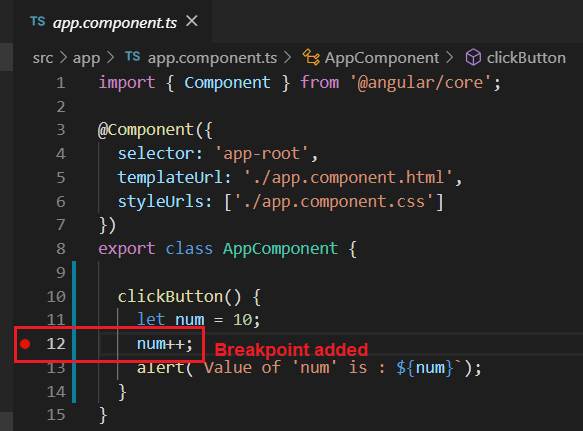
We can add a break point in App component class file and test our application.
We can run the Angular application using below command.
ng serve
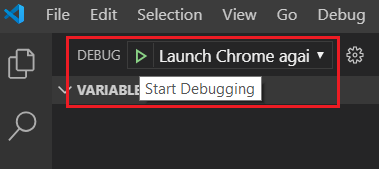
Again, go to Debug toolbar and click “Start Debugging” button.
It will automatically open a new Chrome window.
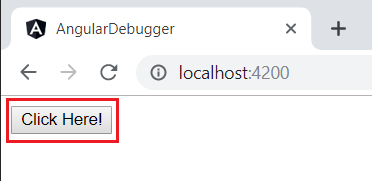
We have already added the break point in “clickButton” method in App component class. You can click above button in application to call that method.
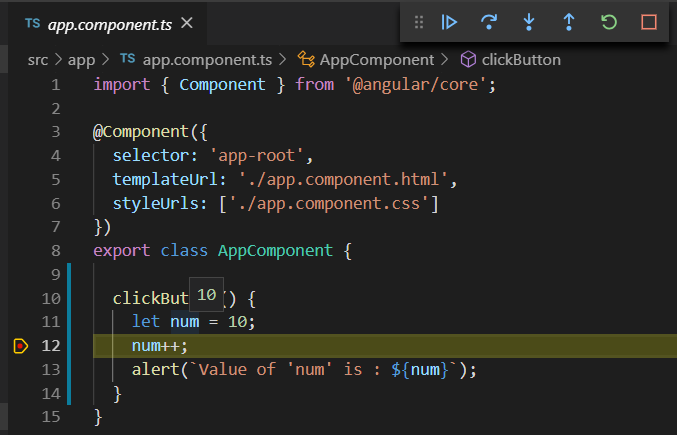
You can see the debugger is successfully invoked. We can use this debugger to debug complex application very easily.
Conclusion
In this post, we have seen how to add Chrome debugger extension in Visual Studio Code, and we have successfully debugged our application using this debugger tool.
Thank you for reading and if you enjoyed this article, please share it with others who may enjoy it as well.!
#angular #angular8 #vscode #cli #chrome

