To run a business today, you need to have access to your order, inventory, and financial data wherever you find yourself working. To support that, on-screen reports must be not only flexible and interactive but also available in a variety of screen resolutions.
With ActiveReportsJS, you can build responsive web applications with highly interactive reporting capabilities that work in any browser, on desktops, and mobile devices.
In this article, we’ll show you how to build a responsive app for order tracking reports with Node.js and ActiveReportsJS. This app will let you drill-down from tables or charts of month-to-month order volumes to individual order and product details.
Building a Web-Based Sales Report
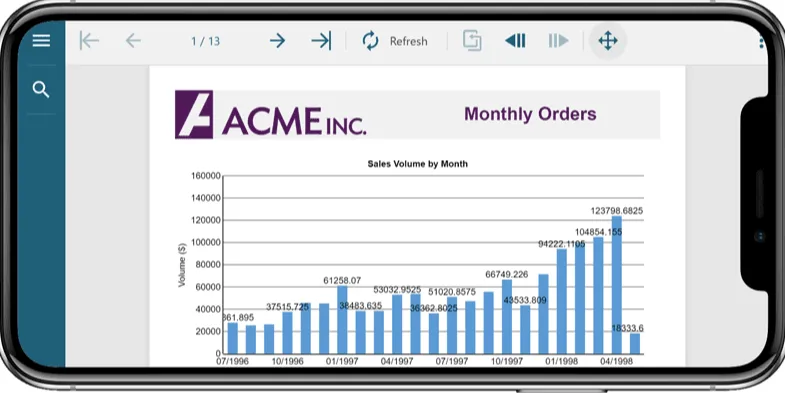
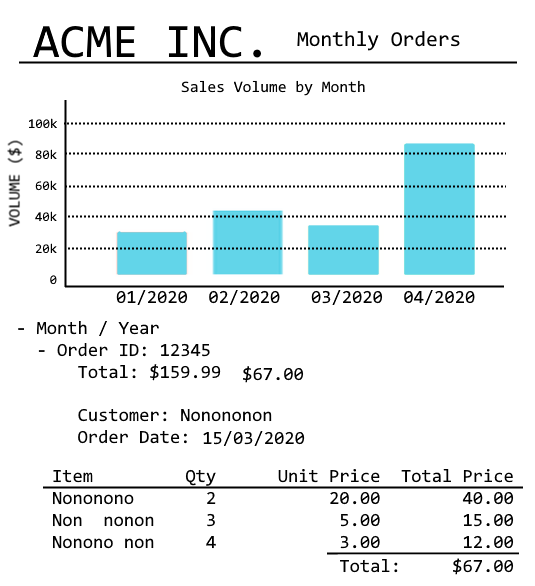
Let’s say a client named ACME Inc. contracted you to build a sales report. The client’s request comes with an attachment, which is a mockup of the real report, and it looks like this:
To create enterprise-level reports like the one above, GrapeCity offers ActiveReportsJS Designer, an intuitive tool that helps you configure your report to fetch data and render it using multiple visual element types, including tables, bar charts, pie charts, and others.
ActiveReportsJS Designer stores report definitions in a special JSON format and saves them in files with the .rdlx-json extension.
Install ActiveReportsJS with the Windows, macOS, or Linux installer.
Design the Report Title
To create a new report, in the Designer, open the File menu. Select the RDL option (standard language for data-driven reports), then save the new report as MonthlyOrders.rdlx-json.
The report title consists of a container that holds a logo image and a label. Notice the control toolbox on the left-hand side.
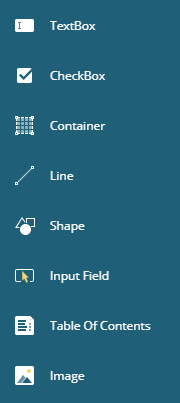
You can drag report controls from the toolbox and drop them onto the report canvas. To create a title with an image and a heading, you’ll need a container to hold these controls. Containers are especially useful for grouping controls that you want to move together.
Drag a container control and drop it onto the top of the report.
Drag an image control and drop it onto the container. The image can be pulled from an external source, such as a URL or a database, or be embedded.
Add a textbox to the container to display the title text. Customize the title font, size, and color as you see fit.
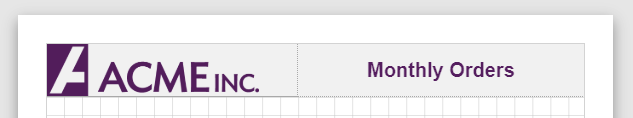
The title should look like this:
Click the Explorer icon on the toolbar.
From the control tree that opens, select the Report node. The properties panel opens at the right-hand side. On the properties tab, change the report margin sizes to 1 cm.
Create a title for the report.
Container
    Background Color: #f1f1f1
    Items:
        Image
            Source: #551e5f
            #551e5f: FitProportional
        Textbox
            Value: "Monthly Orders"
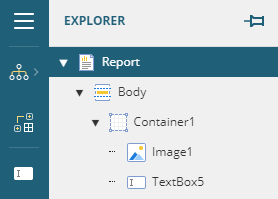
You can use Explorer to select controls and view their properties:
#web #mobile #activereportsjs #node.js #javascript