Executive Summary:
On March 11, 2020 the World Health Organization (WHO) declared the novel coronavirus (Covid19) outbreak as a global pandemic. In this paper, a time series analysis to predict the number of deaths in the United States starting from August 1st — August 21st and August 1st — November 1st is modeled and studied. The time series model that was selected to make the prediction is called Auto Regressive Integrated Moving Average (ARIMA) model.
The paper is divided into the following sections:
- Why & What is Time Series Analysis
- When we can’t use Time Series Analysis
- Components of Time Series Analysis
- Demonstration of Time Series Analysis
- Conclusion
The data has been drawn from “Our World in Data” and consists of the necessary information to conduct the time series analysis. The variables that are relevant to answer our research question are the dates (2019/12/31–2020–08/01), total deaths, new deaths and location (USA). The data has been cleaned and adjusted to satisfy all the necessary assumptions to use ARIMA to make the prediction.
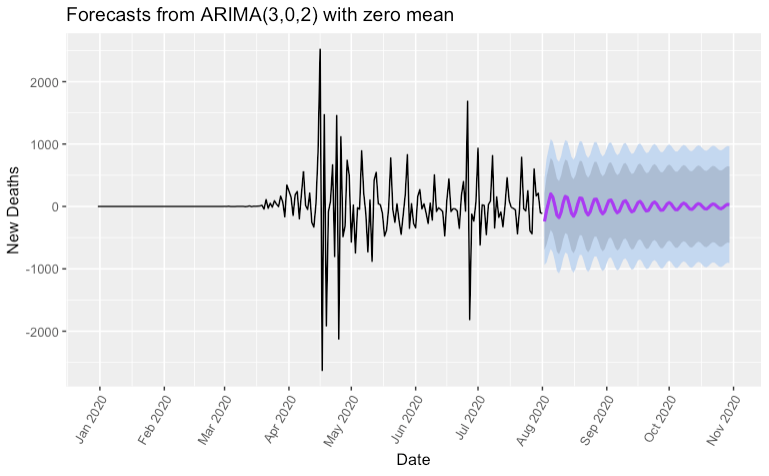
The forecast of new deaths for the next 21 and 90 days reaches 18,589 (Total Deaths 171,903) and 82,653 (Total Deaths 235,967) respectively. The result of our projection has been very close when comparing it to CNN’s projection. CNN projected on August 2nd that about 19,000 people could die between August 2nd and August 21st in the United States. In addition to that prediction, they also predicted on July 31st in their show “CNN Coronavirus Town Hall” the total numbers of death by November. CNN forecasted 231,000 death from Covid19 by November. The results of our ARIMA Model are very close when comparing it to CNN’s projection.
Result:
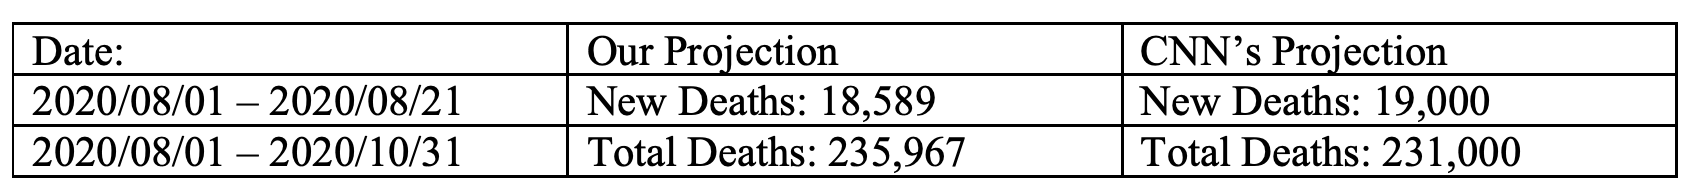
Image by author
1. Why & What is Time Series Analysis:
Time series analysis (TSA) is a statistical technique that consists of data points listed in time order. The x axis is made up of equally spaced points in time and the y axis contains the outcome values that are going to be projected from our model based on previous observed values. This technique is suitable for research questions such as forecasting future sales. The reason why time series analysis exists, is due to the fact that the outcome variable in our model is dependent on one single explanatory variable only: time.
Suppose you run a shoe store and have the data available that tells you how many shoes you have sold in the past years. Given the data available, time series analysis would be applicable if you would like to predict how many shoes your store will sell in the future. In this case, the outcome variable would be the number of shoes sold and the one and only explanatory variable would be time.
Other forecasting algorithms such as linear regression or logistic regression use one or more explanatory variables. Further there is a difference when it comes to the assumptions when comparing linear regression, logistic regression and the time series technique ARIMA.
In Linear Regression the following assumptions have to be met:
- Independence of observations.
- Homoscedasticity of errors (equal variance).
- A linear relationship.
- Errors are normally distributed.
In Logistic Regression the following assumptions have to be met:
- Dependent variable has to binary.
- Independence of observations.
- Linearity in the logit for continuous variables.
- Lack of influential outliers
- Absence of multicollinearity
In Time Series Analysis ARIMA the following assumptions have to be met:
- Data has to be stationary.
- Data should be univariate. As mentioned above TSA ARIMA works on a single variable only.
- Data should be in time series data format.
#data-analysis #r #time-series-analysis #data-visualization #data-science