“Creating an intelligence that can talk about you from the instruments you own.”
Master Article
Objective
Creating the Physical to Virtual KPI for the previous article and making an automated analysis decision based on the artist’s instrumentation.
To understand the interaction of an artist with their song, we need to understand their instruments. To understand their instruments we need a way to fetch their instruments and create a dataset.
Web scraping the Data
Equipboard is a website that serves as a database for the instruments that artists use. The entire database is crowdsourced. The sources vary from
YouTube videos to news articles to interviews. It covers a large spectrum of vision.

The following tools were used to scrape data of artists that had an image on Equipboard (the general assumption was that if the artist were reputed and large enough they would have an image, hence better data quality)
- Python was used as a commander to coordinate the scraping.
- Chrome was used to view the Equipboard web pages.
- Selenium automated the chrome browser to browse all artists.
- Beautiful Soup helped in extracting the data from the HTML page source.
All categories were captured for 1834 artists. The sample being indicative of the artist population of the world.
Cleaning and Analysing the Data
Correlation Analysis — Here, I am trying to see if a correlation is present among certain kinds of instruments, because of the number of columns it made sense to program the plots to be interactive.

Dividing the correlation plots into increments of 0.1 helped to infer the results,
- A negative correlation was not observed. (Musicians are hearty to all instruments!)
- Cellos/Upright Basses & Drums/Drum Sticks/Drum Hardware had a strong (>0.80) positive correlation.
- Studio Equipment/ Keyboards and Synthesizers & Studio Monitors/ Headphones had a moderate (>0.60) positive correlation.
- DAWs had a positive correlation (>0.50) with Software Instruments and Plugins and Studio Monitors
- I’m not considering correlations below 0.50 because looking at the data from a music producer and artist’s perspective there doesn’t seem to be much causal behavior.

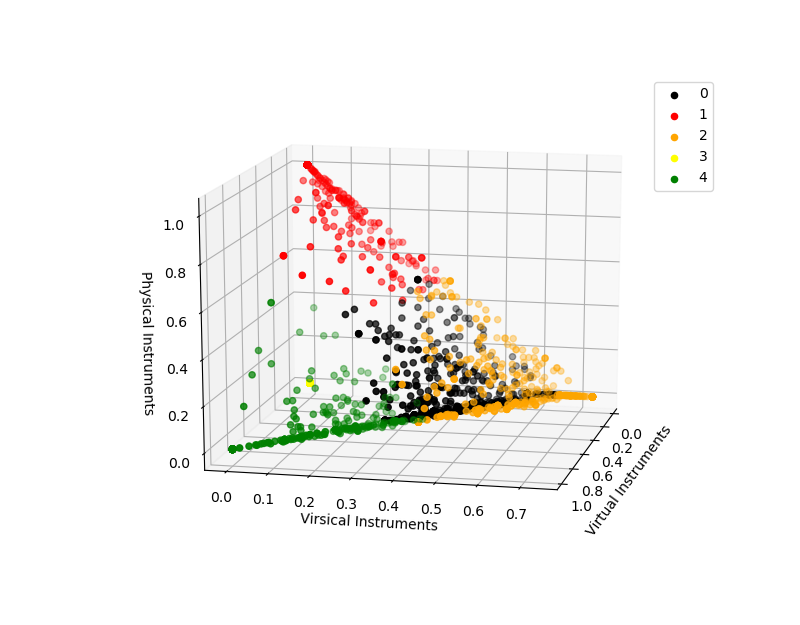
This is how the instrument buckets distribution looks like,
- _Virtual _— Purely Virtual Instruments.
- ‘Virsical’ — A mix of physical and virtual instruments. (This will create our abstraction context!)
- Physical — Purely physical instruments.
- Misc — Extra music/non-music gear of the artist.
- Interface — Parallel to Virsical instruments but serve more as physical connectors.
Let’s look at the compressed correlation.

Key observations,
- Physical and Virtual Instruments are not correlated! These can, in fact, be separate columns in our matrix.
- Virsical and Interface buckets seem to have a mild correlation to software instruments but very little correlation to the Physical bucket (this is expected, a MIDI device needs a software, however, a guitarist doesn’t always need a software, he can do by with an Amp, hence a mild correlation). Keeping this in mind we will have to normalize our weightage for our Interface variable.
- I will not be considering the Misc Bucket for our analysis because it includes non-musical gear like caps and baby groots etc.
#data-science #music-analysis #data-analytics #data analysis