A few percentages of the current population alive witnessed the period of Great depression, also synonymous with the term ‘The Great Crash’ of 1929. An economic selloff event just posts the roaring twenties exacerbated by many factors which have since been the subject of many an investment textbook and classes. Investors bled and lost a huge amount of wealth in equities particularly when it came on the heels of a peek.
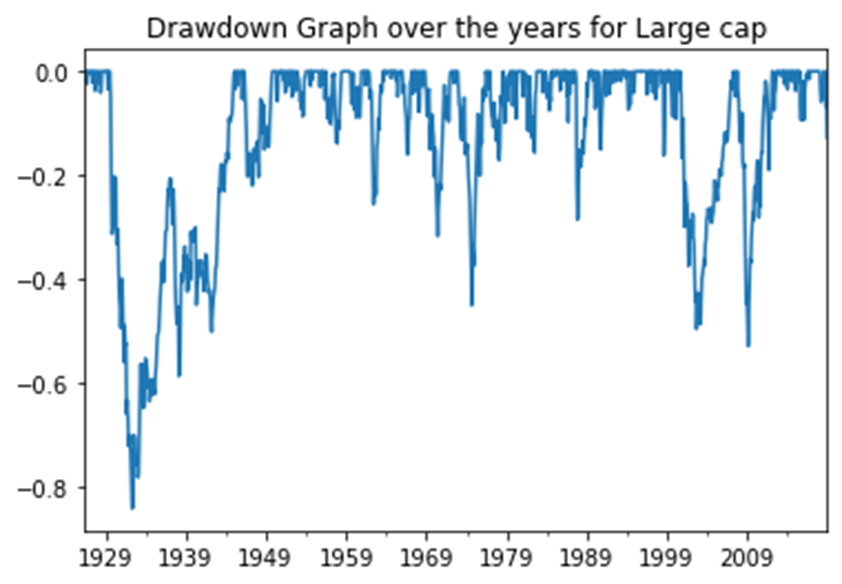
Drawdown is a measure which is used to measure the amount of bleeding/loss that an investor could have experienced if he had bought at the last peak and sold at the subsequent trough. As we will see in our analysis, the loss in returns, if you are highly unfortunate to have bought at the highest last peak and sold at the lowest subsequent trough could have been as high as 80%.
In this article, we have drawn on the analysis done on US Equity market data between 1926 to 2018 to compute the maximum drawdown. The code with comments has been provided at the end of the article as a link to the Github page. You may also like to look at my previous articles on modelling returns and Risk adjusted measures using Python through the below links:
Click here for my article on Risk adjusted Return measure using Python
#investing #data-science #python #pandas