How to set up a logging Infrastructure in Node.js
Setting up the right logging infrastructure helps us in finding what happened, debugging and monitoring the application. At a very basic level, we should expect the following from our infrastructure:
- Ability to free text search on our logs
- Ability to search for specific api logs
- Ability to search per
statusCodeof all the APIs - System should scale as we add more data into our logs
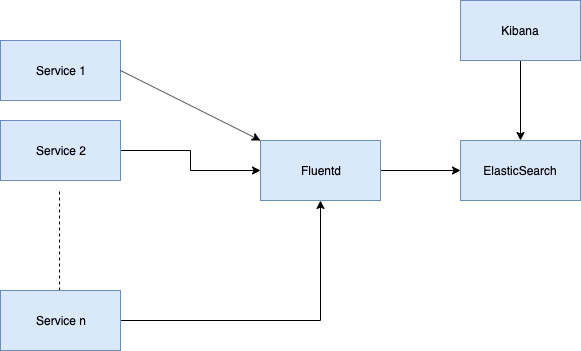
Architecture

Architecture Digram using ElasticSearch, Fluentd and Kibana
Local Setup
We would be using Docker for managing our services.
Elastic Search
Let’s get the ElasticSearch up and running with the following command
docker run -p 9200:9200 -p 9300:9300 -e "discovery.type=single-node" --name myES docker.elastic.co/elasticsearch/elasticsearch:7.4.1
We can check if our container is up and running by the following command
curl -X GET "localhost:9200/_cat/nodes?v&pretty"
Kibana
We can get our Kibana up and running with another docker run command.
docker run —-link myES:elasticsearch -p 5601:5601 kibana:7.4.1
Note that we are linking our kibana and elastic search server using the --link command
If we go to [http://localhost:5601/app/kibana](http://localhost:5601/app/kibana) , we would be able to see our kibana dashboard.
We can now run all the queries against our elastic search cluster using kibana. We can navigate to
http://localhost:5601/app/kibana#/dev_tools/console?_g=()
and run the query we ran before (just a little less verbose)

query for elastic cluster nodes using kibana
Fluentd
Fluentd is the place where all the data formatting will happen.
Let’s first build our Dockerfile. It does two things:
- install the necessary packages
- Copy our config file into the docker file
Dockerfile
FROM fluent/fluentd:latest
MAINTAINER Abhinav Dhasmana <Abhinav.dhasmana@live.com>

USER root

RUN apk add --no-cache --update --virtual .build-deps \
  sudo build-base ruby-dev \
  && sudo gem install fluent-plugin-elasticsearch \
  && sudo gem install fluent-plugin-record-modifier \
  && sudo gem install fluent-plugin-concat \
  && sudo gem install fluent-plugin-multi-format-parser \
  && sudo gem sources --clear-all \
  && apk del .build-deps \
  && rm -rf /home/fluent/.gem/ruby/2.5.0/cache/*.gem

COPY fluent.conf /fluentd/etc/
fluent.conf
# Recieve events over http from port 9880
<source>
  @type http
  port 9880
  bind 0.0.0.0
</source>

# Recieve events from 24224/tcp
<source>
  @type forward
  port 24224
  bind 0.0.0.0
</source>

# We need to massage the data before if goes into the ES
<filter **>
  # We parse the input with key "log" (https://docs.fluentd.org/filter/parser)
  @type parser
  key_name log
  # Keep the original key value pair in the result
  reserve_data true
  <parse>
    # Use apache2 parser plugin to parse the data
    @type multi_format
    <pattern>
      format apache2
    </pattern>
    <pattern>
      format json
      time_key timestamp
    </pattern>
    <pattern>
      format none
    </pattern>
  </parse>
</filter>


# Fluentd will decide what to do here if the event is matched
# In our case, we want all the data to be matched hence **
<match **>
# We want all the data to be copied to elasticsearch using inbuilt
# copy output plugin https://docs.fluentd.org/output/copy
  @type copy
  <store>
  # We want to store our data to elastic search using out_elasticsearch plugin
  # https://docs.fluentd.org/output/elasticsearch. See Dockerfile for installation
    @type elasticsearch
    time_key timestamp_ms
    host 0.0.0.0
    port 9200
    # Use conventional index name format (logstash-%Y.%m.%d)
    logstash_format true
    # We will use this when kibana reads logs from ES
    logstash_prefix fluentd
    logstash_dateformat %Y-%m-%d
    flush_interval 1s
    reload_connections false
    reconnect_on_error true
    reload_on_failure true
  </store>
</match>
Config file for the fluent
Let’s spin this docker machine up
docker build -t abhinavdhasmana/fluentd .
docker run -p 9880:9880  --network host  abhinavdhasmana/fluentd
Node.js App
I have created a small Node.js app for demo purposes which you can find here. It’s a small express app created using express generator. It is using morgan to generate logs in the apache format. You can use your own app in your preferred language. As long as the output remains the same, our infrastructure does not care. Let’s build our docker image and run it.
docker build -t abhinavdhasmana/logging .
Of course we can get all the docker containers up by a single docker compose file given below
docker-compose.yml
version: "3"
services:
  fluentd:
    build: "./fluentd"
    ports:
      - "9880:9880"
      - "24224:24224"
    network_mode: "host"
  web:
    build: .
    ports:
      - "3000:3000"
    links:
      - fluentd
    logging:
      driver: "fluentd"
      options:
        fluentd-address: localhost:24224
  elasticsearch:
    image: elasticsearch:7.4.1
    ports:
      - "9200:9200"
      - "9300:9300"
    environment:
      - discovery.type=single-node
  kibana:
    image: kibana:7.4.1
    links:
      - "elasticsearch"
    ports:
      - "5601:5601"
docker compose file for the EFK setup
That’s it. Our infrastructure is ready. Now we can generate some logs by going to http://localhost:3000
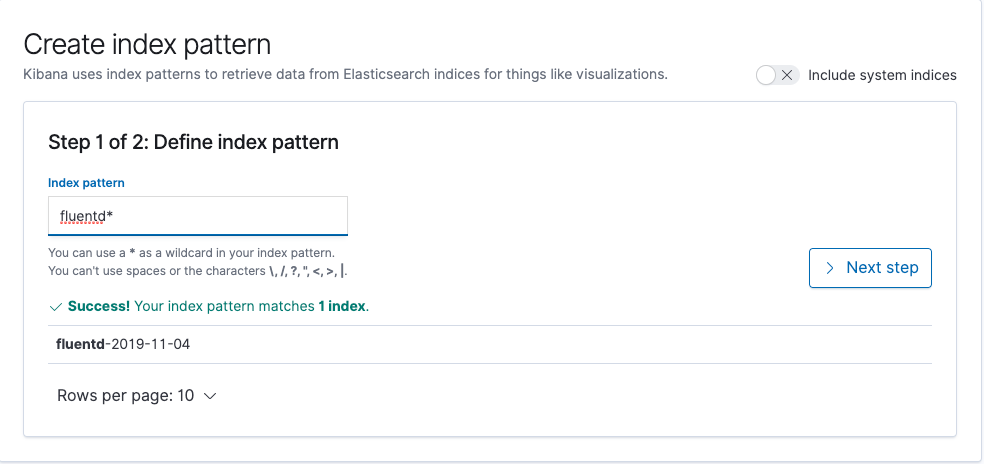
We now go to kibana dashboard again and define the index to use

setting up index for use in kibana
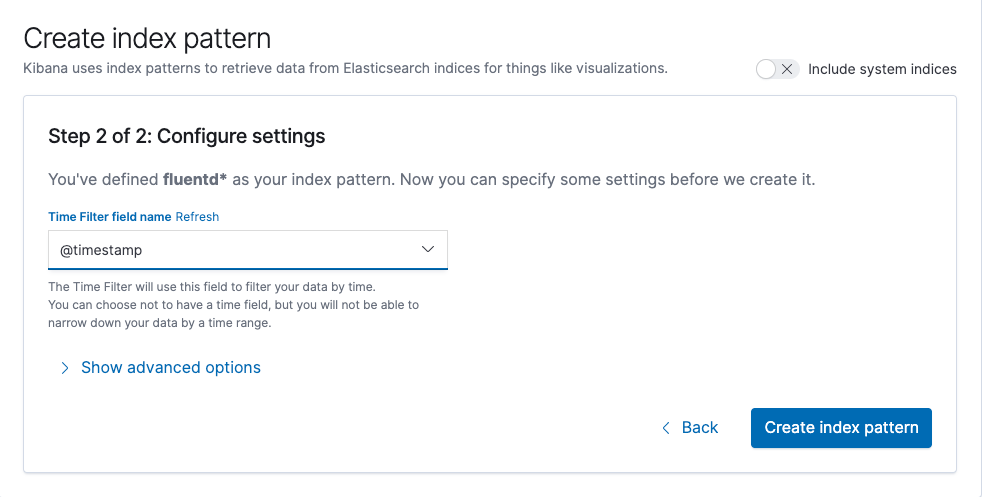
Note that in our fluent.conf , we mentioned logstash_prefix fluentd and hence we use the same string here. Next are some basic kibana settings

kibana configure settings
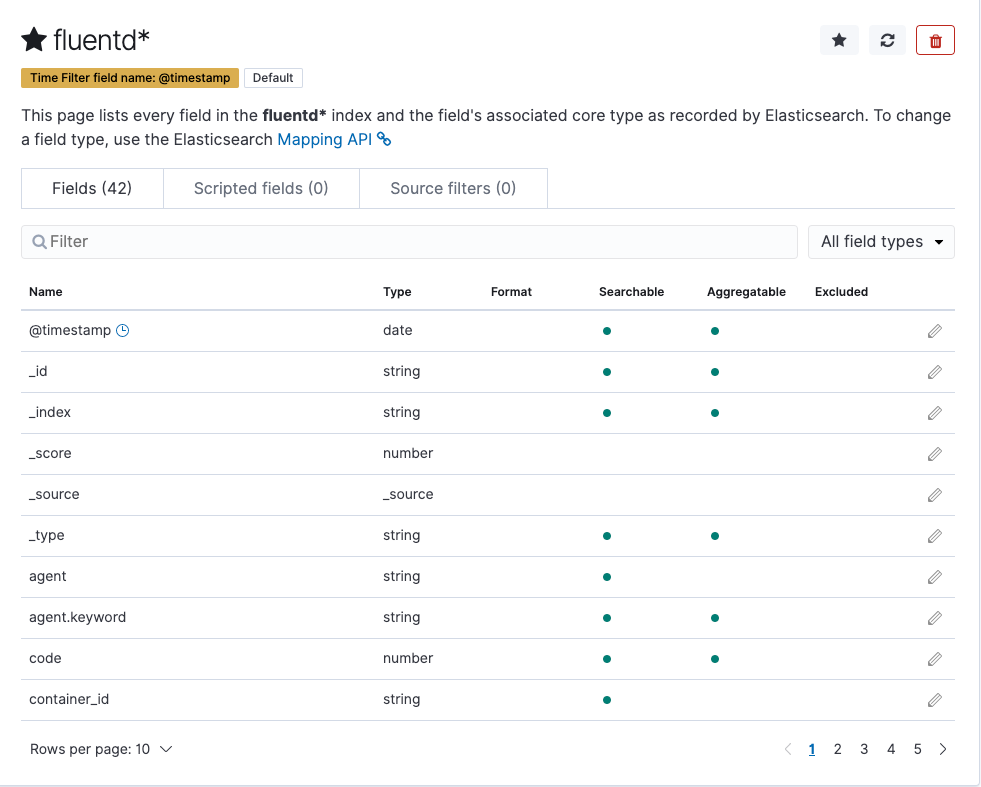
Elastic Search using dynamic mapping to guess the type of the fields that it indexes. The below snapshot shows these

Mapping example of Elastic Search
Let’s check on how are we doing with the requirements we mentioned at the start:
- Ability to free text search on our logs: With the help of ES and kibana, we can search on any field and we are able to get the result.
- Ability to search for specific api logs: In the “Available fields
section on the left of the kibana, we can see a fieldpath` . We can apply the filter on this to look for APIs that we are interested in. - Ability to search per
**statusCode**of all the APIs: Same as above. Usecodefield and apply filter. - System should scale as we add more data into our logs: We started our elastic search in the single node mode with the following env variable
discovery.type=single-node. We can start in a cluster mode, add more nodes or use a hosted solution on any cloud provider of our choice. I have tried AWS and its easy to set it up. AWS also give managed kibana instance for Elasticsearch at no extra cost.
#node-js #nodejs #javascript
