👋 Welcome
Hi! Please take a moment to think about this question:
How is Python applied in real-world scenarios?
If you are learning Python and you want to know the answer, then this article is for you.
Having a clear idea of the applications and vast potential of this programming language will give you the motivation that you will need throughout your journey.
Let’s begin! 🔅
Python in Real-World Scenarios
Python is used in virtually every industry and scientific field that you can imagine, including:
- Data Science.
- Machine Learning.
- Web Development.
- Computer Science Education.
- Computer Vision and Image Processing.
- Game Development.
- Medicine and Pharmacology.
- Biology and Bioinformatics.
- Neuroscience and Psychology.
- Astronomy.
- Other areas such as robotics, autonomous vehicles, business, meteorology, and graphical user interface (GUI) development.
This article covers a wide range of applications of this programming language in these industries with examples, use cases, and Python libraries. Let’s start with the applications of Python in data science.
🔹 Data Science: Analysis and Visualization
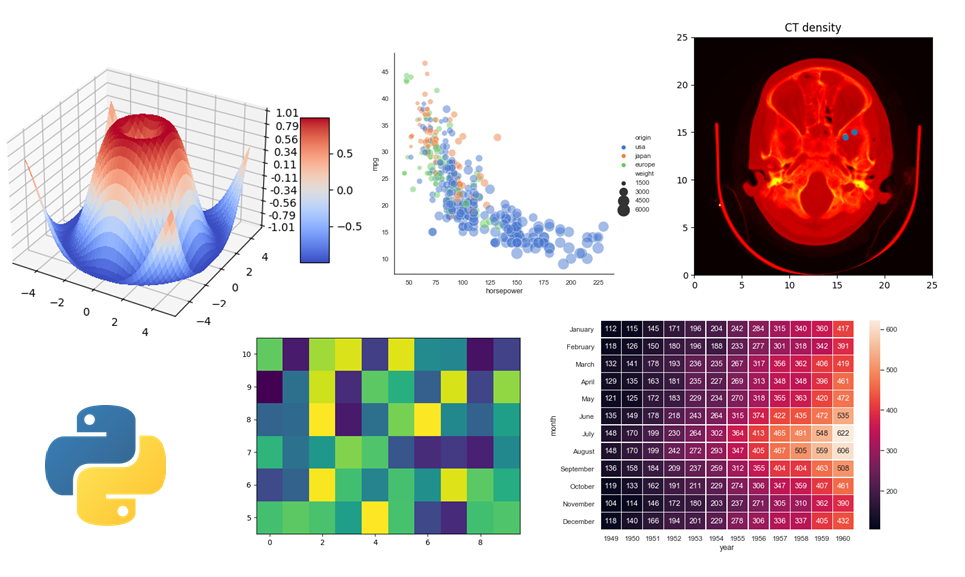 Sample data visualizations from the Matplotlib and Seaborn galleries
Perhaps one of the most popular applications of Python is data science. The power of the Python libraries developed for data analysis and visualization is amazing. Let’s see why.
Data Science Applications
With a Python data visualization library, you can create a wide variety of plots and visual representations, such as:
- Lines, Bars, and Markers.
- Images, contours and fields.
- Subplots, axes and figures.
- Statistics (Box Plots, Bar Charts, and Histograms).
- Pie and polar charts.
- 3D Plots.
- and more!
You can add text, labels, annotations, color, shapes, collections, animations, and interactivity to your plots depending on the package or library that you choose to work with.
💡 Tip: You can see some examples of data visualizations generated with Python in the image above.
Libraries and Packages
Let’s see some of the most popular packages and libraries to work with Python in data science:
Python for Data Analysis
- NumPy: this package is described as “the fundamental package for scientific computing with Python”. According to the official website of this package, “nearly every scientist working in Python draws on the power of NumPy.”
- Pandas: is “a fast, powerful, flexible and easy to use open source data analysis and manipulation tool.”
Python for Data Visualization
- Matplotlib: is “a comprehensive library for creating static, animated, and interactive visualizations in Python.” If you are curious about what you can do with this library, check out the example gallery.
- Seaborn: is “a Python data visualization library based on matplotlib.” If you are curious about what you can do with this library, check out the example gallery.
- ggplot2: is “a system for declaratively creating graphics, based on The Grammar of Graphics”. According to its official website: “you provide the data, tell ggplot2 how to map variables to aesthetics, what graphical primitives to use, and it takes care of the details.”
- Bokeh: is “an interactive visualization library for modern web browsers”.
- Pandas:this library has many tools for data visualization.
#python #web-development #machine-learning #developer