Fetch and clean data automatically with GitHub Actions + R
The GitHub OCTO team recently released their first project: Flat Data. The project aims to offer “a simple pattern for bringing working datasets into your repositories and versioning them.” And it succeeds in doing so! I recently incorporated Flat Data into one of my projects, allowing me to finally stop manually updating the data on a semiregular basis (yikes!). While working, I couldn’t find any documentation on using R with Flat Data. Here, I’ll explain the steps I took to incorporate R scripts into a Flat Data pipeline.
Note:_ If you want to follow along, the GitHub repo can be found here._
What’s Flat Data?
Flat Data solves the problem of carrying out the same repetitive tasks-retrieving, cleaning, and then republishing data-that commonly affects developers who want to present rapidly updating data (for example, COVID-19 data that updates daily). And although alternative solutions exist, Flat Data is easy, intuitive, and integrated directly with your GitHub repository:

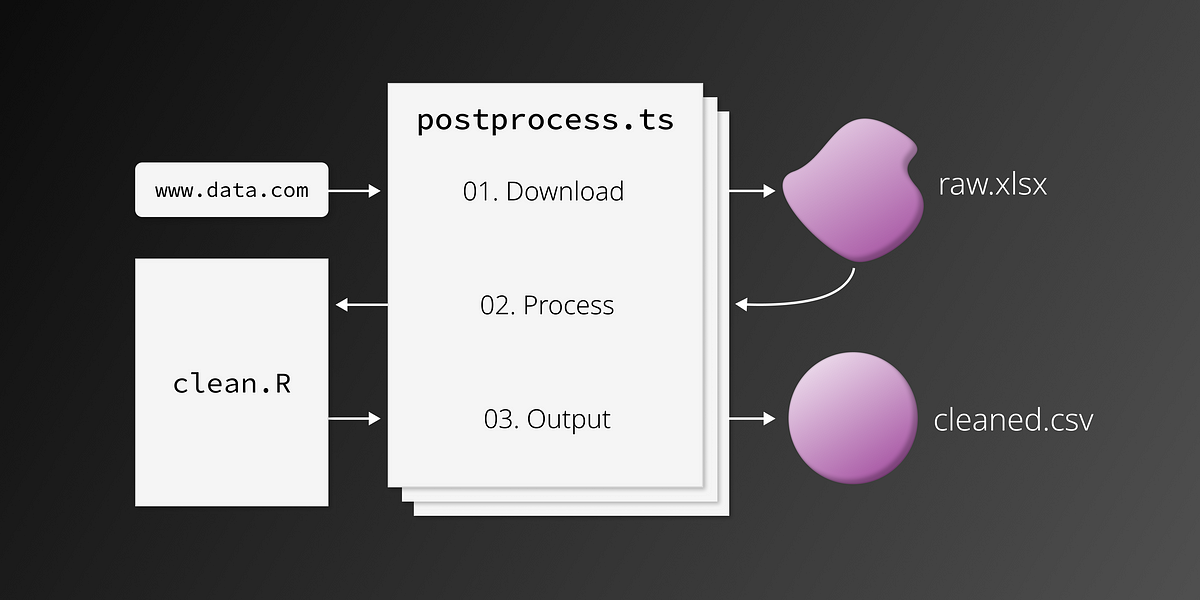
The GitHub Flat Data workflow. Image via GitHub Octo.
The idea, as seen above, is essentially to read in data ( data.json), conduct some postprocessing ( process.js), and output some better data ( processed-data.json).
Doing it in R
The most essential step of a Flat Data project is postprocessing. This occurs after data retrieval and before data output, and it can be done in a few different languages. By default, the OCTO team’s examples are done in JavaScript/TypeScript, and one user has given an example of postprocessing in Python. To the best of my knowledge, though, there aren’t any examples of including R in the postprocessing stage, hence the reason for this post!
Using R in a Flat Data pipeline is as simple as installing the necessary packages and then sourcing your R cleaning script from a postprocessing TypeScript file. Let’s explore how that works.
We’ll be grabbing data from the Mapping Police Violence homepage, tidying it up, and then republishing it. (This cleaned data is the source for my visualization on police violence.) Here’s the final data output.
#github-actions #github #r