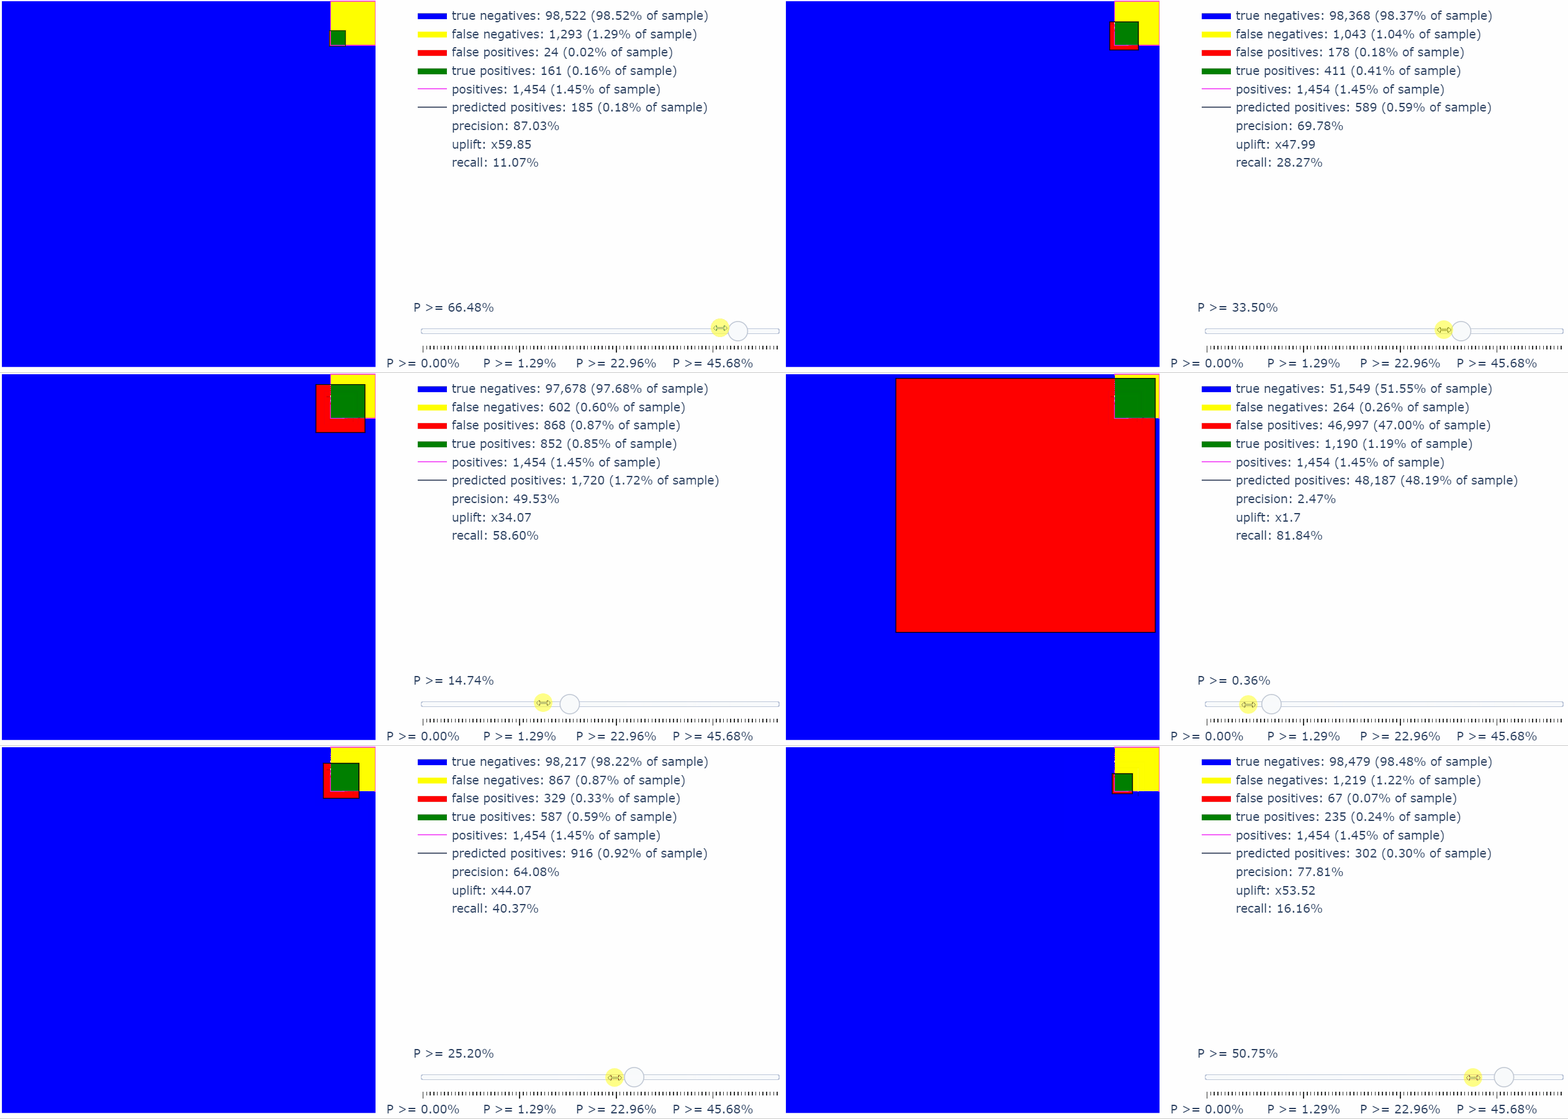
TL;DR
5 lines of code for people in a hurry:
! pip install git+https://github.com/smazzanti/confusion_viz

	from confusion_viz import ConfusionViz

	conf_viz = ConfusionViz()
	conf_viz.fit(y_true, probas_pred)
	conf_viz.show()
Introduction
Binary classification is the most common task in machine learning. It’s also pretty general, since n-class problems and regression problems can be both reduced to the binary case (of course with some loss of information).
Say that you have gathered your data, cleaned it and fitted a classifier. Unfortunately, when the job is over, the job has just begun! In fact, you still have to deal with a lot of stuff: true positives, false positives, false negatives, accuracy, precision, recall, … And to boot, all these are multiplied by the number of possible thresholds (there are easily thousands of them).
This is why I started looking for a single (possibly graphical and interactive) representation, containing all the relevant information regarding a binary classification task. Given that this visualization is founded on confusion matrices, I’ve called it “confusion_viz”.
#data-visualization #confusion-matrix #classification #data-science #python
