One of the many services provided by the US Geological Survey (USGS) is the monitoring and tracking of seismological events worldwide. I recently stumbled upon their earthquake datasets provided at the website below.
The site has data feeds that contain ‘live’ csv data for every significant earthquake over the past hour, day, week, or month. The data is updated every minute and contains magnitudes, lat/long, depth, and other earthquake descriptors.
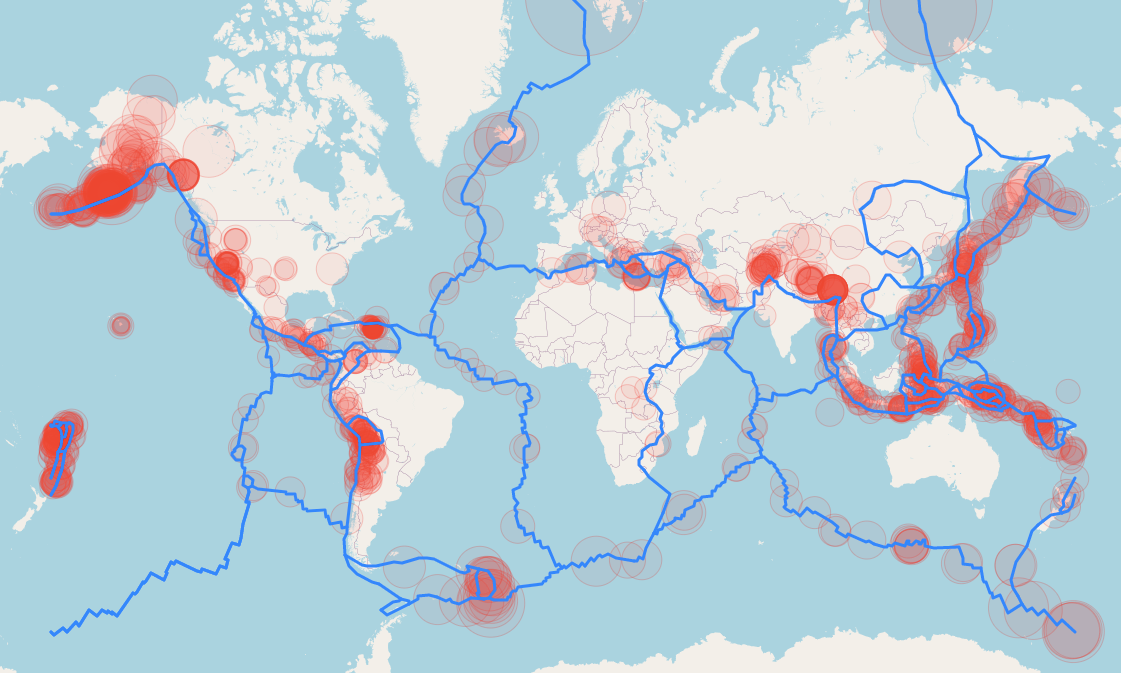
While there are lots of earthquake visualizations out there, I thought it would be a fun exercise to see what could be easily created in Folium from the raw data.
#python #folium #data-science #usgs
4.75 GEEK