Agenda
- Building a Graph Using Publication Metadata
- Creating a TigerGraph Account
- Designing a Graph
- Uploading & Mapping Data
- Loading Data
- Visualizing the graph
1. Building a Graph Using Publication Metadata
This project is a continuation of a previous project. We used scispaCy, an NLP package for Python, to extract medical keywords from the abstracts of a collection of articles on Covid-19. Check out that post for an in-depth guide on how we extracted the data. The goal of this project is to build a graph to connect the publications to the entities we extracted. We are using a graph because it allows us to efficiently display and analyze our highly connected data. If you aren’t already familiar with graphs, I suggest checking out this video. To create our graph, we’ll be using a free, UI-based graphing platform from TigerGraph called TigerGraph Cloud.
2. Create a TigerGraph Account
Before you do anything else, you will first need to create a TigerGraph account. TigerGraph has a great video that takes you through the steps to create your account and build an empty graph. Follow along with the steps in the video, and load up your solution in GraphStudio. After the solution is loaded, you should reach this homepage.
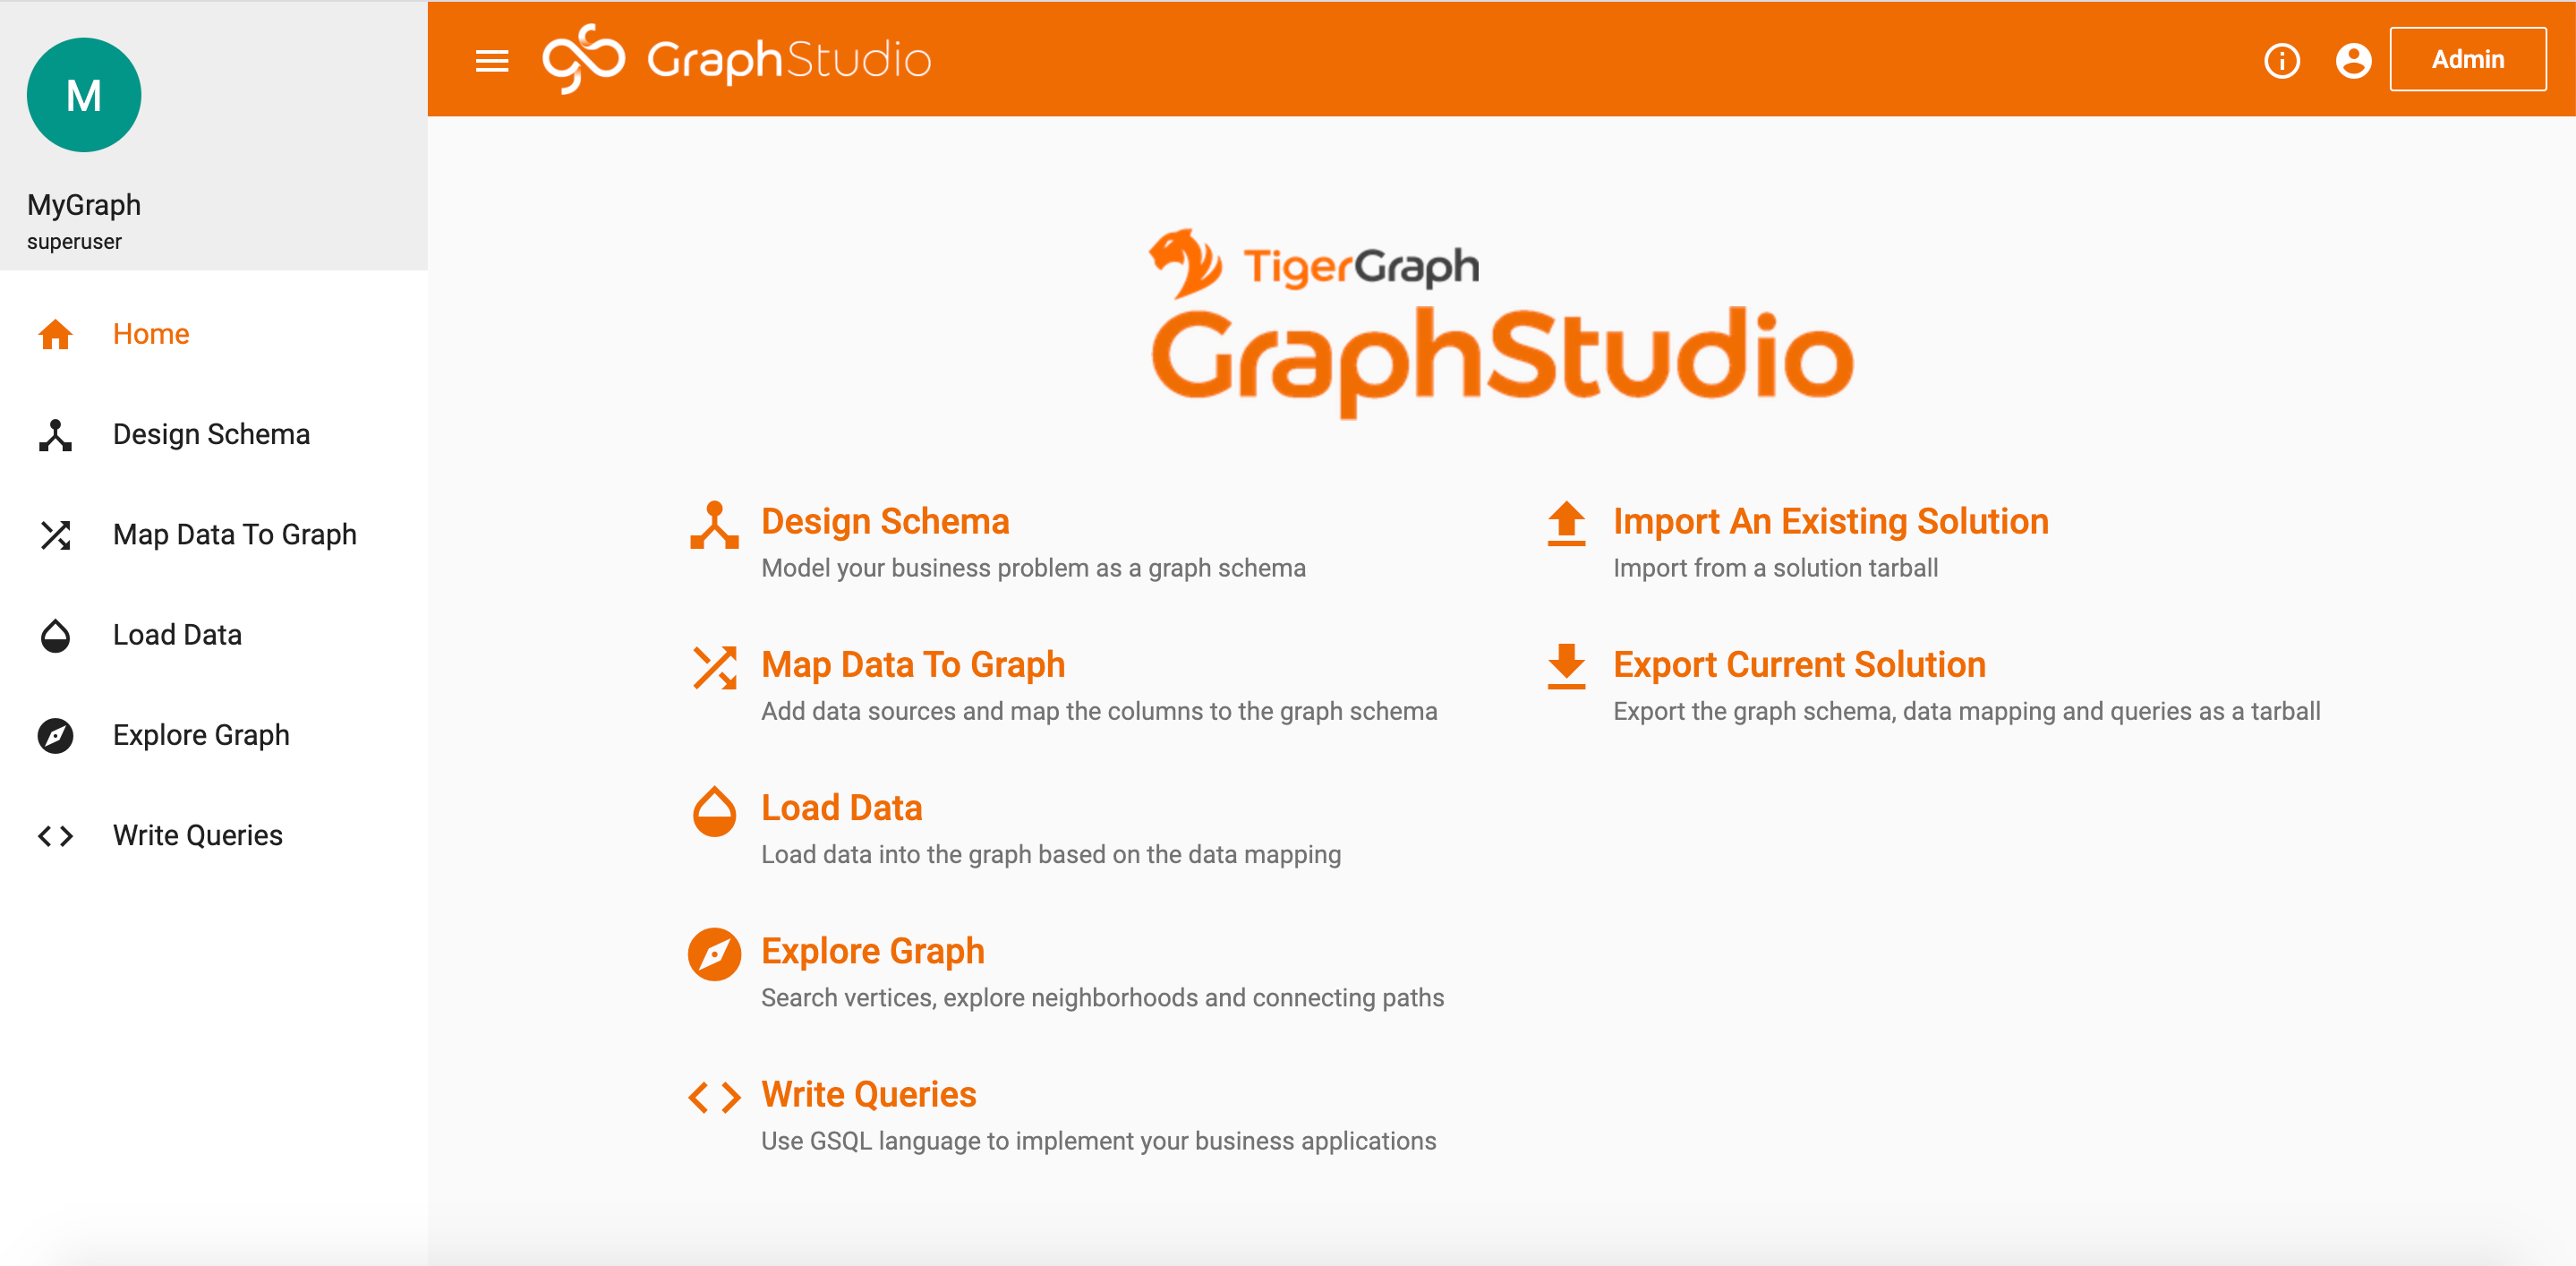
Home Screen
3. Designing a Graph Schema
We’ll start by clicking the Design Schema tab.
You should see a blank page that looks something like this.
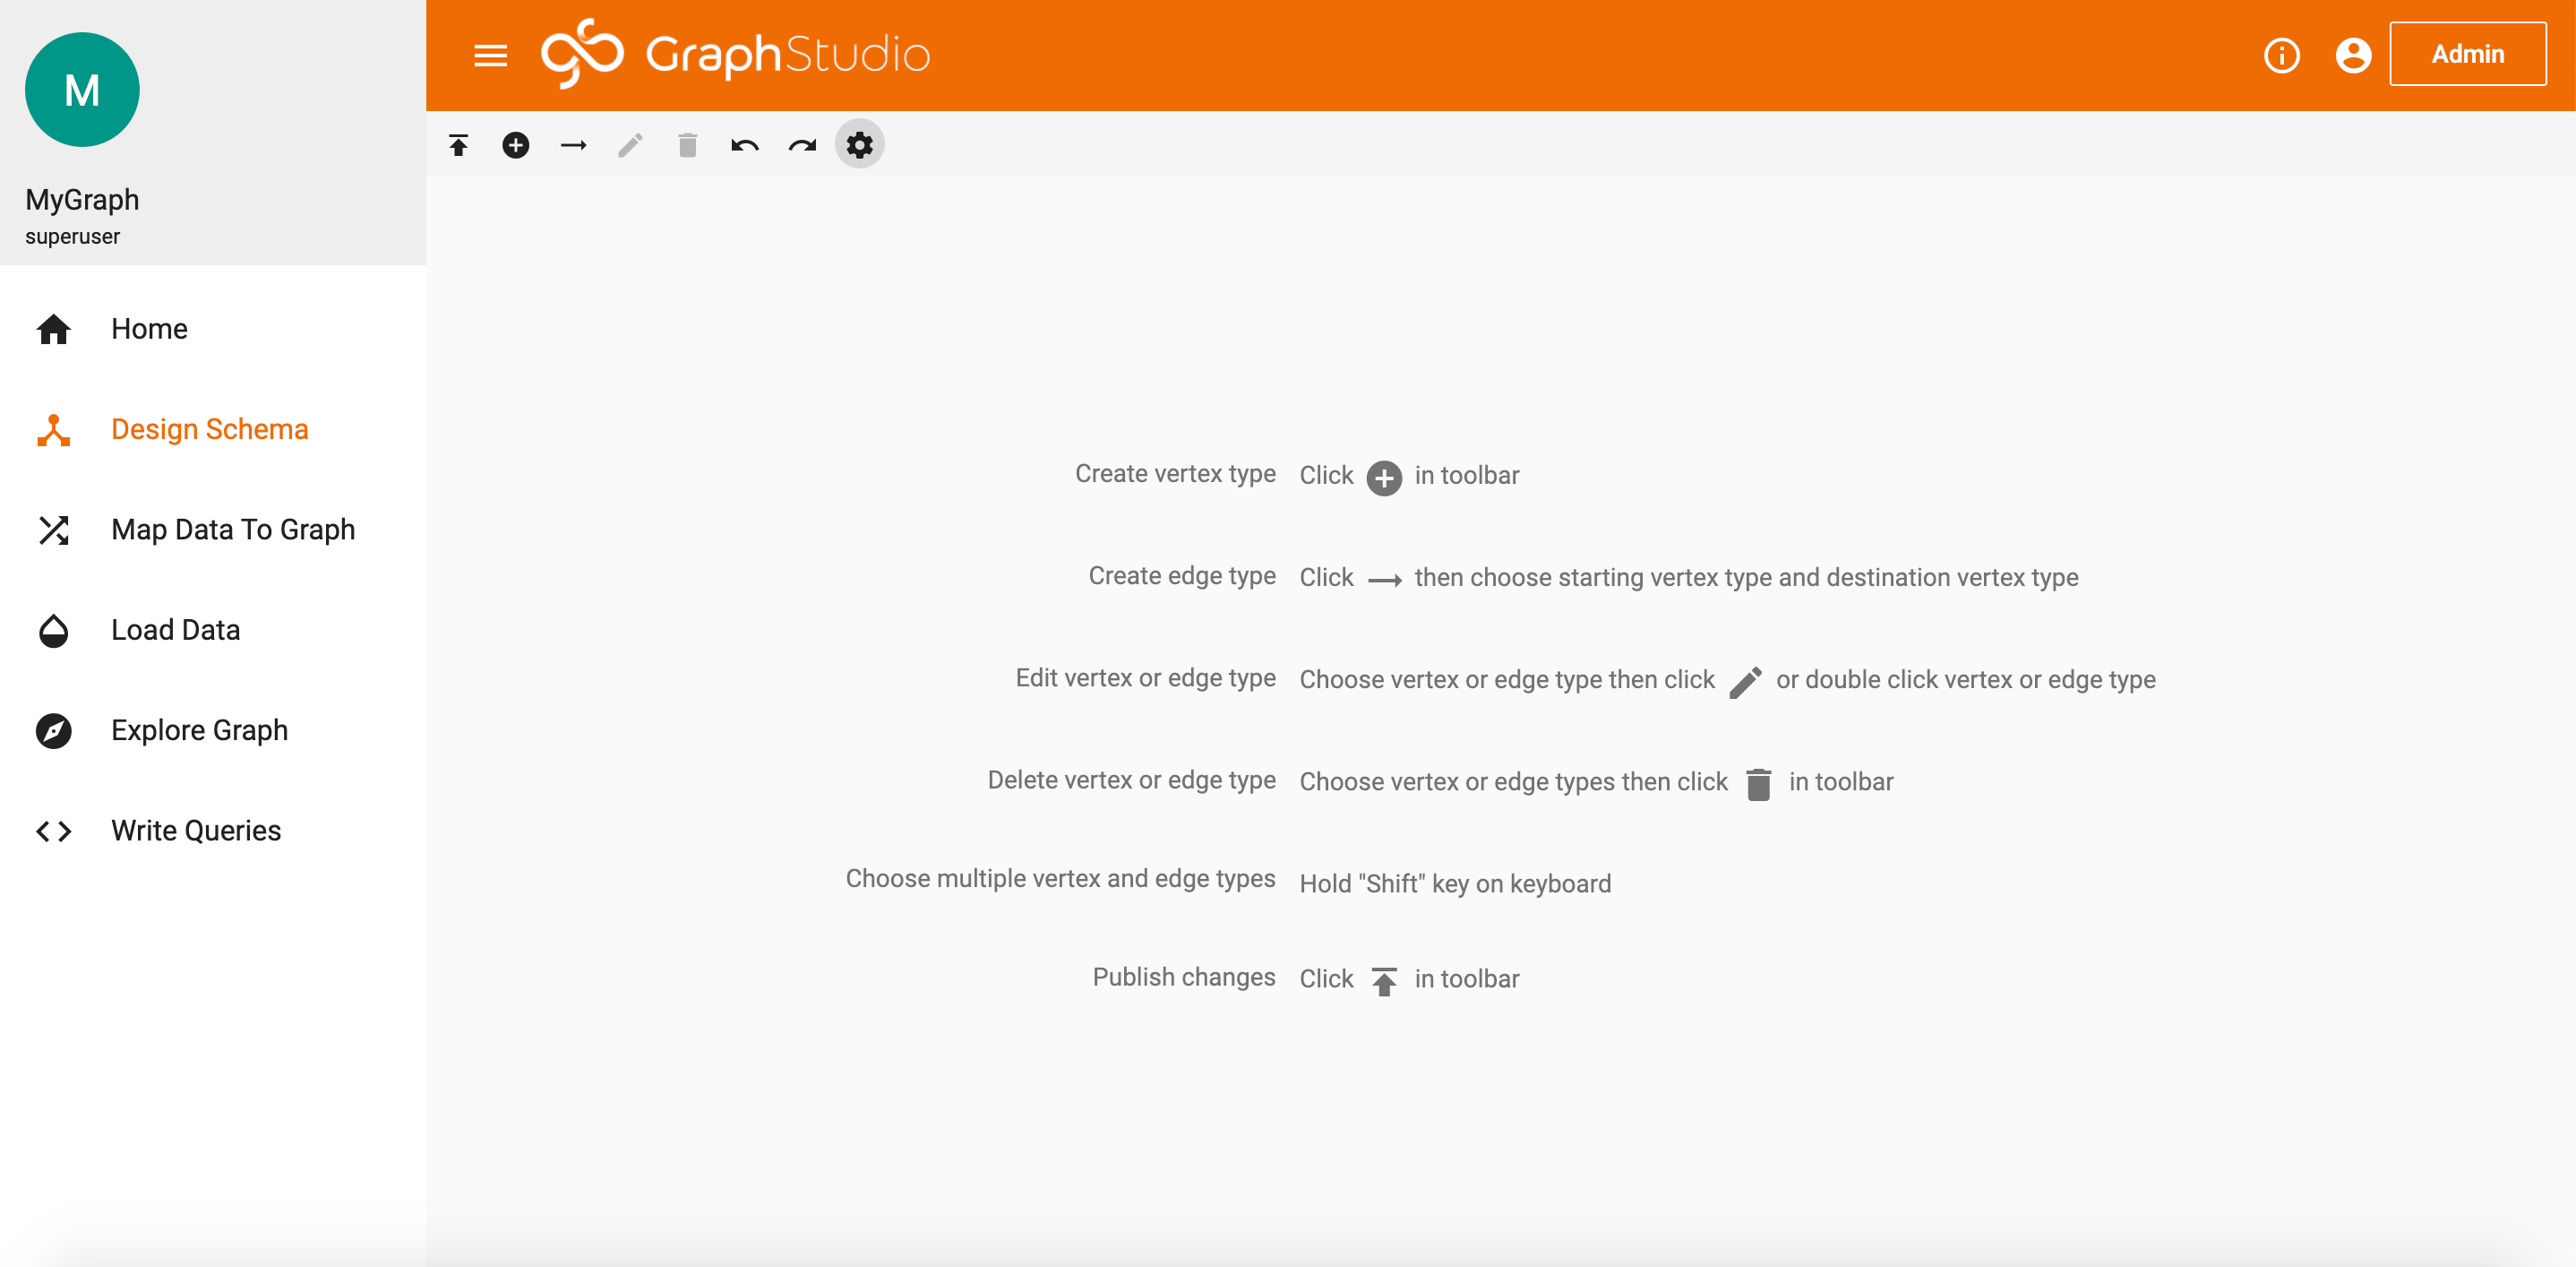
Blank Design Schema
ADDING VERTICES
Next, we’ll create some vertices. Our central vertex type will be called “PUBLICATION”. This vertex will store data related to the publication like the doi, the title, and the URL. These specific properties for a vertex type are known as attributes. To create the vertex, press the + icon. Fill in the data as follows.
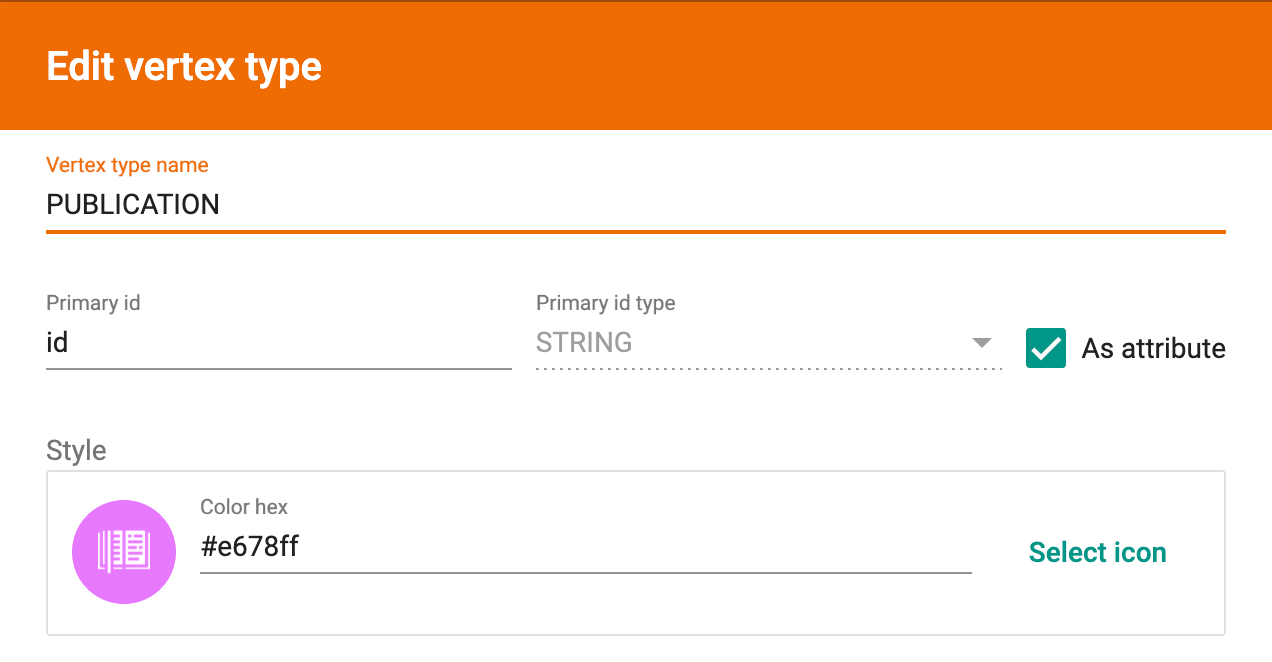

Publication Vertex
You’re free to edit the names of the vertices and their attributes to whatever names you like, as well as customize the icon and color for each vertex type. Just make sure the attribute types are correct.
There are some publication attributes, like the license type and journal of publication, that we didn’t list here. That’s because ideally, attributes are traits that will be UNIQUE for each vertex of a given type. Since multiple publications can have the same license, journal, etc., it’s best to leave those as SEPARATE VERTEX TYPES. We can still easily connect those vertices in our design schema.
Let’s continue creating our vertices. We’ll need 3 new vertices for highly repetitive publication traits (license, author, and journal), a vertex for the entities we extracted previously, and a vertex for the classes of those entities. These vertices should look like this.

#data-science #data-visualization #graph #database #tigergraph #data analysis
