Facing an SQL Server performance issue, you need to identify the source of that performance problem fast. Therefore, a tool for tracking the current workload and detecting the bottleneck issues without causing extra load is necessary.
SQL Server provides various tools to collect the SQL Server events. For instance:
- The SQL Trace tool, introduced in SQL Server 2000. It lets you define classes of events you plan to collect with many T-SQL stored procedures. You can collect certain events using the SQL Profiler or call it from the code. But the latter required specific development skills and effort.
- The SQL Server Profiler tool. You can use it to collect performance-related events, detect expensive queries, and enhance performance. It allows collecting variant numbers of SQL Server events and filter them according to your scenario variables.
- The SQL Server Extended Events tool, a light-weight event tracking tool, was introduced in SQL Server 2008 and enhanced in SQL Server 2012. It allows you to create and configure an Extended Events session, consisting of many predefined events. The tool targets performance-related events and issues, thus replacing deprecated SQL Trace and SQL Profiler tools.
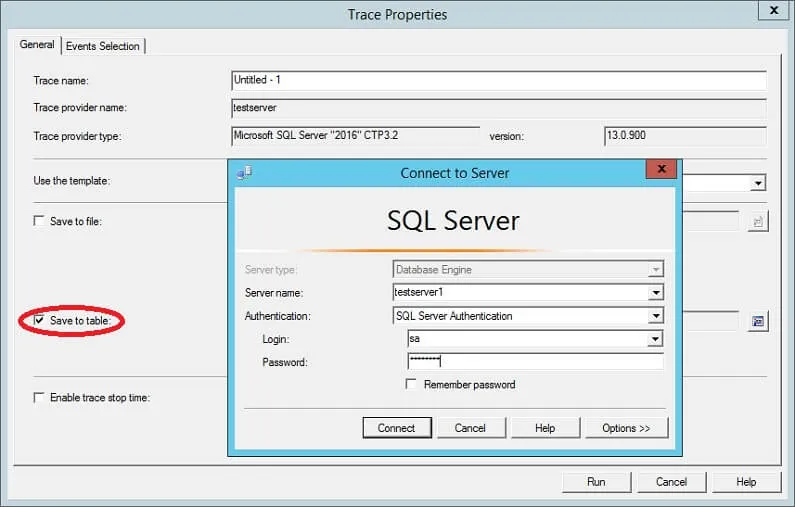
The built-in profiling tools produce different impacts on your production environment when you configure them to collect SQL Server events. Besides, setting up and configuring these tools require development skills quite often. For instance, setting up the SQL Trace scenario is such a task.
All these tools require at least installing the SQL Server Management tools. The problem is, it might not be an option for some environments for security reasons. Such tools are applicable to connect to the SQL Server instance and retrieve the data.
Fortunately, the SQL Server administration tools market provides numerous options for SQL Profiling tools. One of the most useful and FREE SQL tracing tools is the free dbForge Event Profiler for SQL Server tool.
Using the dbForge Event Profiler for SQL Server tool for tracing events
This FREE solution lets you capture and analyze the SQL Server resources consumption and expensive queries-related events. You can store these data in a physical trace file for later troubleshooting and analysis. It also allows you to view all sessions running on your SQL Server and the queries executed under these sessions. In general, the Event Profiler applies to more than 1500 traceable events.
The dbForge Event Profiler helps define the application, node, or user with the heaviest running activity. It identifies the T-SQL statement or stored procedure with the worst performance and impact on the SQL Server, tracking the SQL Server resource consumption. It’s also worth mentioning the ability to collect events related to the SQL Server Analysis and Integration Services.
Compared to other SQL Server built-in profiling tools, the dbForge Event Profiler guarantees the highest tracer performance with the lowest server overload. You can download the application free of charge from the Devart download page and install to your machine:
When the installation is complete successfully, the wizard will notify about it and allow you to launch the Event Profiler tool at once:
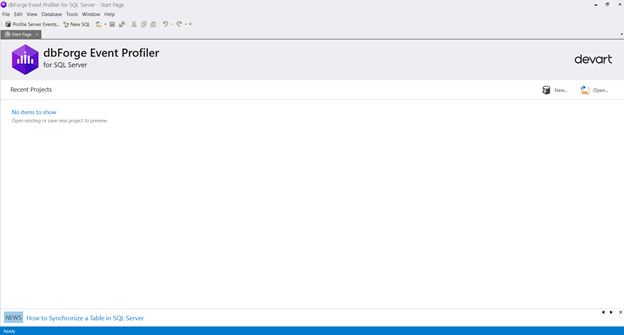
Configuring the dbForge Event Profiler for SQL Server tool
The tool has a user-friendly, simple interface, and robust functionality:
#programming #sql server #event profiler #performance #sql database #sql server #sql trace