OVERVIEW: PROBLEM STATEMENT
A small insurance company, Texas Giant Insurance (TGI) focuses on providing commercial and personal insurance programs to its clients. TGI is an independent insurance company with an in-depth knowledge of multiple insurance products and carriers. They proactively provide service to their policyholders and present them to their clients.
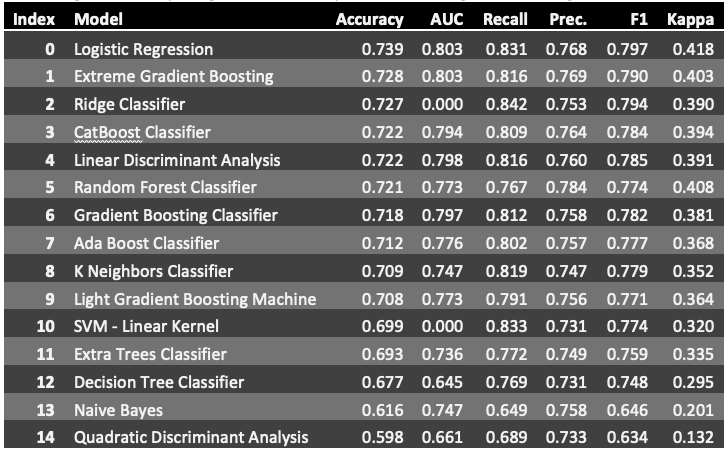
The goal of this project is to first, validate that a NN model is more powerful in accuracy than other models and two, how we can leverage this information to mitigate customers from leaving and reclaim customers that have left TGI.
DATA: EVALUATE DATA & CONDUCT EXPLORATORY DATA ANALYSIS
The dataset we received was of TGI customers between January 2017 and December 2019. The dataset was not properly formatted to be consumed by our models, but we did not have any missing values. As with insurance companies, their data is usually stored in a system that was not made for analysis but rather for accounting purposes. A significant amount of time was spent to learn the data features and determine any meaningful features that should be extracted. After going back and forward with the client (TGI), we ended up getting access to the data of 794 customers (observations). However, 81 of these observations were of customers who had inquired about products and services from TGI but never ended up becoming a customer. We ignored these observations, and this reduced our dataset to 713 observations. Since the insurance industry is heavily regulated, I was not able to get additional demographic information of the customer and had to do the best I could with the provided dataset.
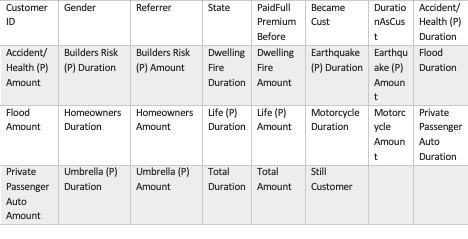
Table 1: Selected & Newly Created Features
We created new features from the dataset that was provided and formatted the data, so each observation is associated with that customer. One of the features we created was the duration of the customer (DurationAsCust) so that even if the duration of the policy changed or the type of policies changed between the years, we could capture the entire value of the customer. Another feature we created was to capture the significance of the customer so if the customer had multiple policies per year, we wanted to capture the sum of all those policies for the life of the customer (Total Duration).
We created new features from the dataset that was provided and formatted the data, so each observation is associated with that customer. One of the features we created was the duration of the customer (DurationAsCust) so that even if the duration of the policy changed or the type of policies changed between the years, we could capture the entire value of the customer. Another feature we created was to capture the significance of the customer so if the customer had multiple policies per year, we wanted to capture the sum of all those policies for the life of the customer (Total Duration).
Exploratory Data Analysis (EDA):
Most of the EDA figures, as well as, Histograms, Correlation Plot, Mean, Standard Deviations, Minimum, Maximum and other summary statistic as part of EDA are provided in the report (see PDF file in Github).
Figure 1 shows us the split of our response (target) variable: StillCustomer (0: Not a Customer, 1: Still a Customer). Out of 713 observations, 62.7% (448) are still a customer and 37.2% (265) are no longer a customer. While we want a good balance between the classes in our response variable, the 63% to 37% split is not terrible. We did execute class weights function in the sklearn library to balance the model but realized that it was not making a significant impact. Therefore, we elected to not balance the data as we did not want to make the model more complicated than it was necessary.

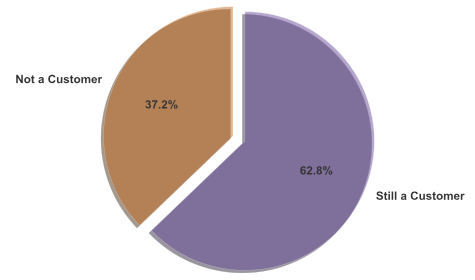
Figure 1: Proportionate of Customers
A feature that we had created was looking at whether during the life of the customer, it ever paid a premium in full instead of financing it or paying it in installments. Since we did not have any socioeconomic information about the customer, we wanted to derive any information that would be indicative of their economic standing. Figure 2 shows that there is a split among customers who are no longer active and whether they have ever paid full their premium. However, if we look at those who are still a customer, we see a large portion of these customers having paid their premiums in full at the least once during their lifetime at TGI.

Figure 2: Comparing Customers with having Paid Full Premium Before
Duration of a customer and total value derived from a customer are quite important when looking at ways to improve customer experience and ultimately increase revenue. Figure 3 shows us a Kernel Density Estimation (KDE) plot to estimate the Probability Density Function (PDF) of duration in months compared to whether the customer is still active. What is interesting is that there is an intersection between the two classes at approximately 40 months. It would require further analysis to gauge whether that intersection exists because of the type of service that occurred with the customer at that time.
#data-science #customer-churn #bayesian-optimization #neural-networks #pycaret #neural networks