A hands-on guide for implementing some of the most beloved tools in the spatial python community
Over my career I’ve worked on many geospatial related projects using the ArcGIS platform, which I absolutely love. That means I get to consult in projects with cutting-edge geospatial technologies, like Multidimensional Rasters, Deep Learning, and spatial IoT automation. With that in mind, I always try to keep track of how to perform the same operations I’m working on without Esri’s beautifully crafted systems.
Over the last few weekends during an exceptionally tedious quarantine I’ve worked on this little script that would reproduce something I’ve been developing with ESRI’s Living Atlas to achieve NDVI Zonal Statistics (Normalized Difference Vegetation Index, a classic in Remote Sensing) for rural land plots.
The plan here was to perform an entire geoprocessing and remote sensing routine without having to resort to any GIS Desktop software. We’re starting out with a layer that contains some parcels in which we’re intersted and a layer with protected areas where special legislation applies. Nothing else is allowed outside python! This is our plan du jour:
- Check the parcels geojson layer for invalid geometries and correcting those;
- Calculate the area for each parcel in hectares;
- Verify for each parcel if it intersects any protected areas;
- Calculate the area of intersection for each parcel and insert the name of the protected area on the parcel’s attributes;
- Get the latest five Sentinel-2 satellite imagery with no clouds;
- Calculate the NDVI on each image;
- Calculate zonal statistics (mean, min, max and std. dev.) for the NDVI on each parcel;
- Create a map showing the results clipped in each parcel.
Let’s get started
So. First things first. We have to import the geojson file that has the land plots stored in it. For that, we’ll be using the geopandas library. If you’re not familiar with it, my advice is get acquainted with it. Geopandas basically emulates the functions we’ve been using in classic GIS Desktop softwares (GRASS, GDAL, ArcGIS, QGIS…) in python in a way consistent with pandas — a very popular tool among data scientists — to allow spatial operations on geometric types.
In order to import our geojson, the first thing we must note are the data types in geopandas. Basically, when we ran the .read_file method, we assigned a geodataframe type to the polygons variable. Inside every geodataframe there will always be a geoseries , which we can access via the .geometry method. Once we find the geoseries , we can make use of the .isvalid method, that produces a list of True/False values for each record in our series.
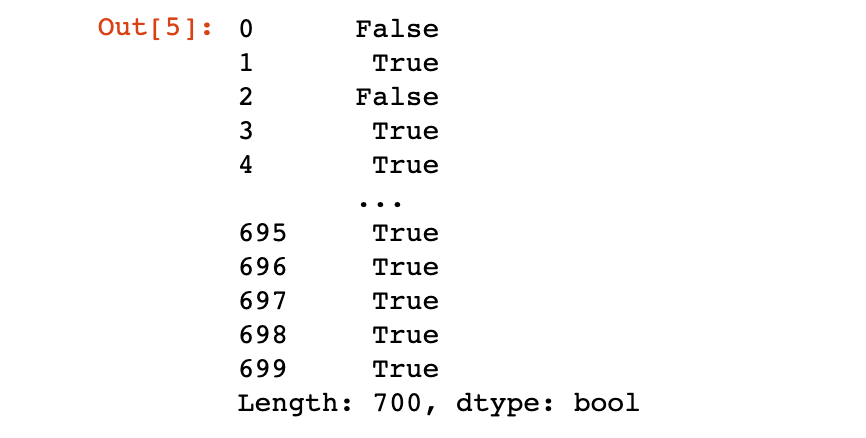
And of course there are invalid geometries hanging in our dataset. It comes as no surprise, since those land plots came from the CAR Registry, where every rural land owner in Brazil have to self-declare the extent of their own properties.
So, how do we fix that? Maybe you’re used to running the excelent invalid geometries checking tools present in ArcGIS or QGIS, which generate even a report on what the problem was with each record in a table. But we don’t have access to those in geopandas. Instead, we’ll do a little trick to correct the geometries, by applying a 0 meter buffer to all geometries.
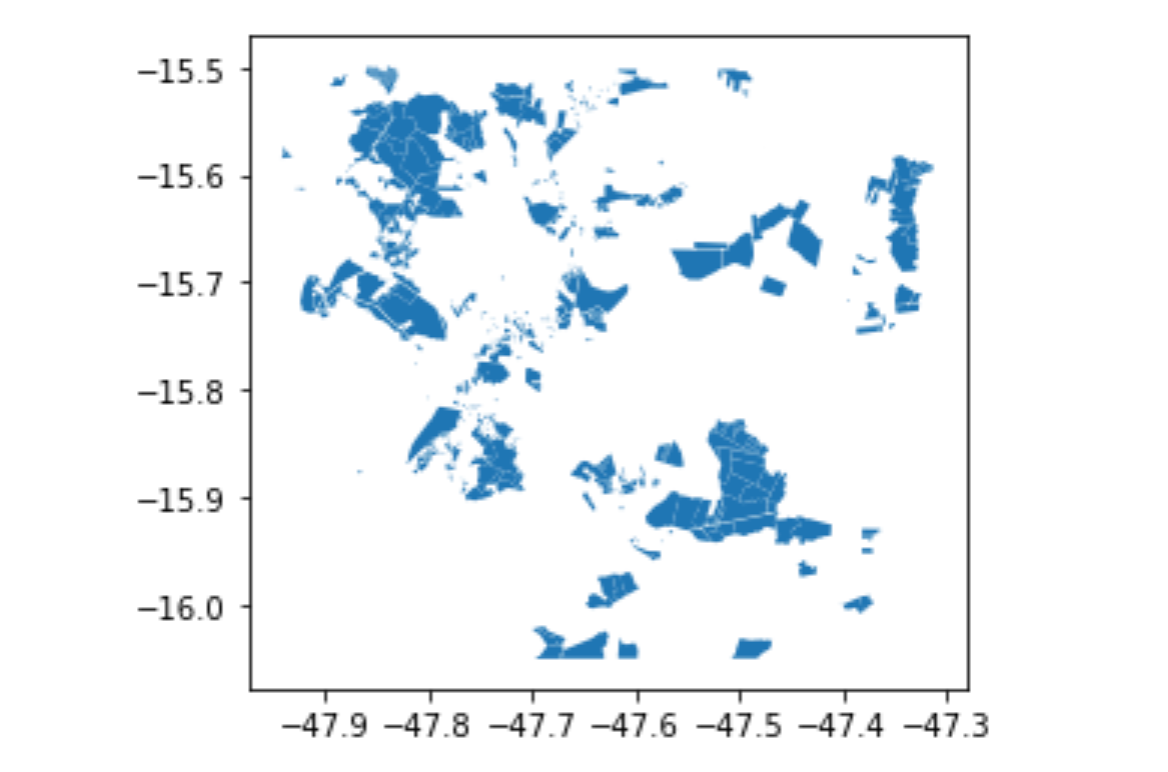
And now we’ll finally get to take a look at our polygons, by using the .plot method, which is actually inherited from thematplotlib components in geopandas .
This is a fast and useful way to get a quick notion of what our data looks like spatially, but it’s not the same as a map.
#python #towards-data-science #geopandas #google-earth-engine #geospatial