whenever it comes to visualizations for data plotly comes out as a standout package to choose among multiple options especially when it comes to interactivity also plotly comes with Dash which is really a handy framework for creating powerful Dashboards. when there are times when you have live data and that too with multiple figures.
And well its sometimes easy to set an interval for each figure and make Dash update the figure in that interval but consider if the data you are using is shared between all the figures. so you have to process the data in each callback, yep!.. you have to do the same computation multiple times and you can not update the data outside the callback because than it won’t be updated also you can’t use global variables because it will break your app especially when you are having user inputs.
now the one way is to create a hidden div and process and store the data in that and then use it as an input for your callbacks you can find this example in here
But what if this is the case
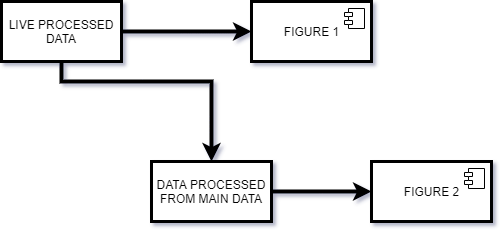
that is for each figure you have to process the data from the main live data. In this case, you have to process read the data from JSON string in each callback which is again computationally expensive and you might get bugs.
thus a better way to do is to use multiple outputs
#data-visualization #livedata #plotly #dashboard #dash #data analysis