Kite diagrams are classically used in both ecology and biology studies and also form part of the school syllabus on A-Level Biology courses in the UK. Despite this, there are few options for creating these diagrams in standard software visualisation packages, and most seem to still be hand drawn. This short post will explain how to automate this process with Python 3 and the matplotlib library.
**So what are Kite diagrams? **Kite diagrams provide a graphical summary of different observations made along a transect. A transect is a line placed across a part of a habitat, or an entire habitat. This is often done manually with string, rope etc. The quantity of various species can be counted at regular intervals along the transect. The distribution of the various species can be affected by various different factors including predators and also by other environmental factors like heat, light and moisture levels. These are referred to as abiotic (not alive) factors. Data can also be collected using a quadrat, this involves using a square (e.g. 1m2) frame that is moved along the transect. The number of species in the square can then be counted at each point.
Kite diagrams are a way of seeing the change in abundance of the various species along a transect.
This allows researchers to see the relative abundance of certain species in different places in a habitat such as a seashore. There may be many types of grass, plants and insects for example distributed over the shore at different points.

A variety of species can be found along a seashore (Photo by Life Of Pix from Pexels)
These diagrams are often produced by hand, and there seems to be little in the way of support for them in standard visualisation packages. We found one example in Excel (Luke, 2019) and one produced using R (Hood, 2014), but nothing using Python. As Python is being used increasingly to analyse data, we thought we would have a go at implementing a simple Kite diagram using Python. This was done using an interactive Jupyter notebook with Python 3. We present the process here for those in other fields that may find automating such diagrams useful. We have deliberately tried to keep the implementation basic for beginners.
For the example, we will use Python’s ‘pandas’ library to represent the dataset that we will use. This dataset was entered into Excel and saved as a Comma Separated Values (CSV) file. We will also use the numpy library to extract columns from the dataset and apply operations to them. As is the convention in Python, we can refer to these libraries using a short hand reference (pd for pandas and np for numpy).
import pandas as pd
import numpy as np
Importing the data
Next, we load the dataset into a pandas dataframe object using the pandas read_csv() function, supplying the path to the CSV file. We store this data in a variable called kite_data that can then be viewed in the notebook (or other Python environment).
kite_data = pd.read_csv("./biology/kitedata.csv")
kite_data
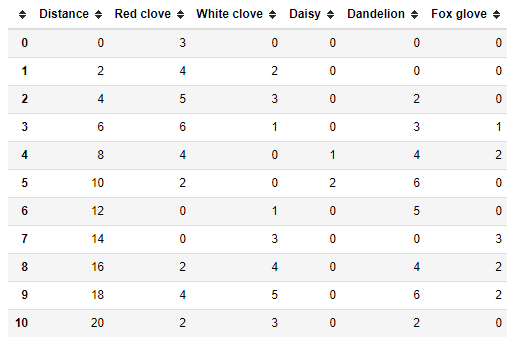
The dataset (Image by authors)
The first column of the data should represent the distances. This will be used for the horizontal axis. The remaining columns represent the frequency of species or sometimes the percentage cover of certain plants that will be plotted at intervals on the y-axis.
#kite-diagram #a-level #biology #ecology #python #programming