Statistical-model fitting and analysis of results, visualization techniques, and prediction of the outcomes.
Photo by Uriel Soberanes on Unsplash
This article will explain a statistical modeling technique with an example. I will explain a logistic regression modeling for binary outcome variables here. That means the outcome variable can have only two values, 0 or 1. We will also analyze the correlation amongst the predictor variables (the input variables that will be used to predict the outcome variable), how to extract the useful information from the model results, the visualization techniques to better present and understand the data and prediction of the outcome. I am assuming that you have the basic knowledge of statistics and python.
The Tools Used
For this tutorial, we will use:
- Numpy Library
- Pandas Library
- Matplotlib Library
- Seaborn Library
- Statsmodels Library
- Jupyter Notebook environment.
Dataset
I used the Heart dataset from Kaggle. I have it in my GitHub repository. Please feel free download from this link if you want to follow along:
rashida048/Datasets
Contribute to rashida048/Datasets development by creating an account on GitHub.
Let’s import the necessary packages and the dataset.
%matplotlib inline
import matplotlib.pyplot as plt
import seaborn as sns
import pandas as pd
import statsmodels.api as sm
import numpy as np
df = pd.read_csv('Heart.csv')
df.head()

The last column ‘AHD’ contains only ‘yes’ or ‘no’ which tells you if a person has heart disease or not. Replace ‘yes’ and ‘no’ with 1 and 0.
df['AHD'] = df.AHD.replace({"No":0, "Yes": 1})

The logistic regression model provides the odds of an event.
A Basic Logistic Regression With One Variable
Let’s dive into the modeling. I will explain each step. I suggest, keep running the code for yourself as you read to better absorb the material.
_Logistic regression is an improved version of linear regression. We will use a Generalized Linear Model** (GLM) _**for this example.
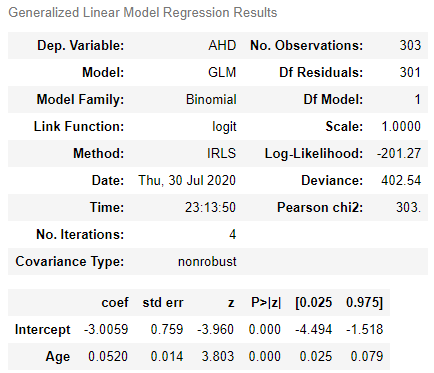
There are so many variables. Which one could be that one variable? As we all know, generally heart disease occurs mostly to the older population. The younger population is less likely to get heart disease. I am taking “Age” as the only covariate. We will add more covariates later.
model = sm.GLM.from_formula("AHD ~ Age", family = sm.families.Binomial(), data=df)
result = model.fit()
result.summary()

#statistics #machine-learning #data-science #python #logistic-regression