Currently, to collect metrics from the AWS CloudWatch we are using AWS’s own [cloudwatch-exporter](https://github.com/prometheus/cloudwatch_exporter), see the Prometheus: CloudWatch exporter — сбор метрик из AWS и графики в Grafana post (in Rus), but it has a few gaps:
- it’s written in Java, so uses CPU/memory of the monitoring host
- doesn’t scrapes AWS tags from resources
- uses the
[GetMetricStatistics](https://docs.aws.amazon.com/AmazonCloudWatch/latest/APIReference/API_GetMetricStatistics.html)method to grab the data - can collect metrics from an only one AWS region, e.g. us-east-1 or eu-west-2
To mitigate those issue — let’s try to use the [yet-another-cloudwatch-exporter](https://github.com/ivx/yet-another-cloudwatch-exporter) instead.
AWS CloudWatch — gaps
Tags
The first thing which is making the “default” exporter uncomfortable is the fact that it will not grab the tags from resources in AWS.
For example, an Application Load Balancer metric will be returned with the only such label:

However, if you’ll check it in the AWS Console you’ll find much more tags there:

And at this moment there is no way to use those tags from Grafana.
GetMetricStatistics vs GetMetricData
The other issue with the default exporter is the API method used to collect data — [GetMetricStatistics](https://docs.aws.amazon.com/AmazonCloudWatch/latest/APIReference/API_GetMetricStatistics.html).
Two years ago was there created an issue Reduce cost of api operations by using GetMetricData API instead of GetMetricStatistics API — but it still wasn’t applied.
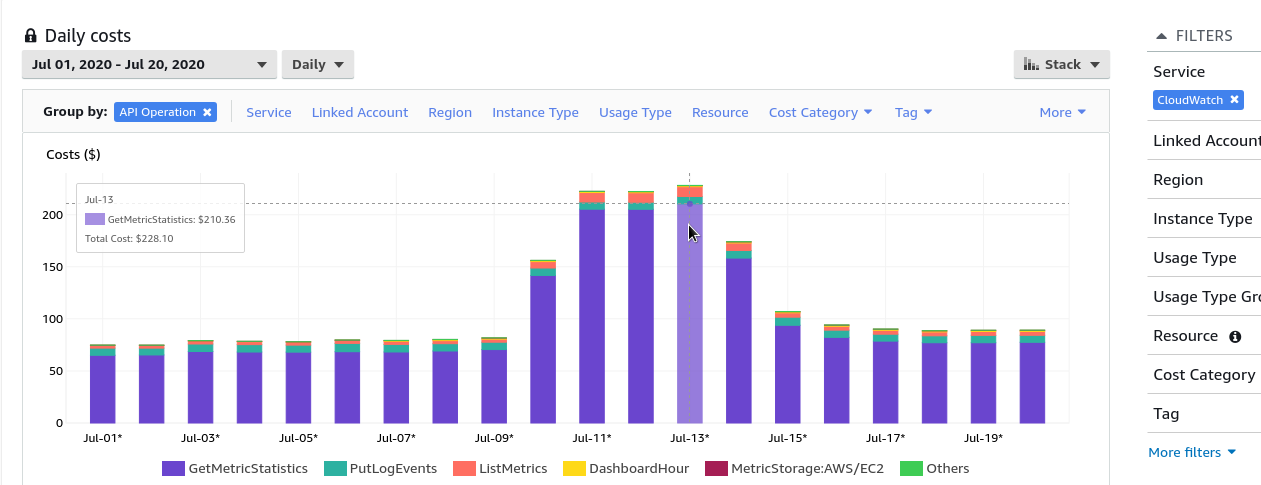
So, the problem with the [GetMetricStatistics](https://docs.aws.amazon.com/AmazonCloudWatch/latest/APIReference/API_GetMetricStatistics.html) is how it collects metrics - for each metric your cloudwatch-exporter will cause a dedicated API-call.
E.g. if you have 100 EC2 instances, and each will have 10 metrics — cloudwatch-exporter will perform 1000 every 60 seconds which will result in big expenses for you:

#monitoring #aws-cloudwatch #aws #grafana #prometheus
