Vue Charts - Rich & Interactive Graphs with Real-time data
Overview
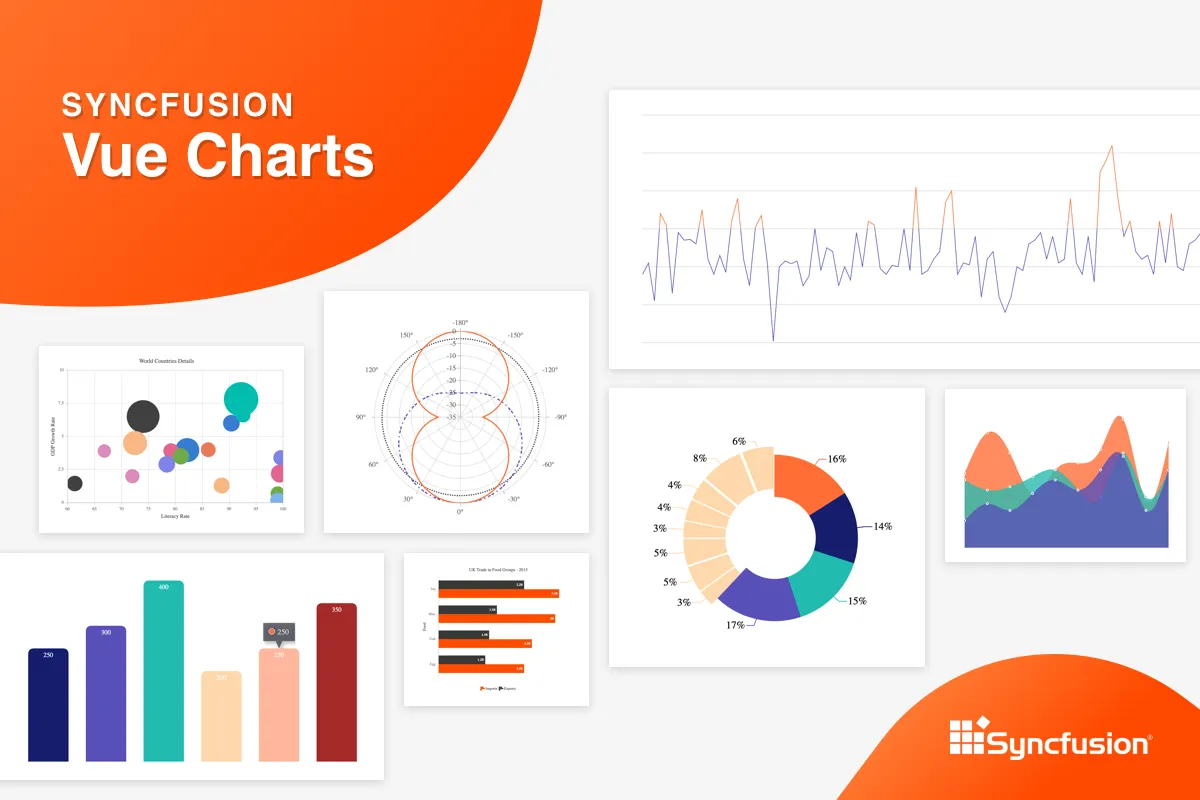
The Vue Chart is a well-crafted charting component to visualize data. It contains a rich UI gallery of 30+ charts and graphs, ranging from line to financial that cater to all charting scenarios. Its high performance helps render large amounts of data quickly. It also comes with features such as zooming, panning, tooltip, crosshair, trackball, highlight, and selection.
- 30+ Chart types
- Fast paced performance
- Elegant animation
- Simple configuration and API
- Support all modern browsers
- Mobile-touch friendly and responsive
- Detailed documentation
https://www.syncfusion.com/vue-ui-components/vue-charts
#vue #charts #graphs #web-development #rich & interactive

1.35 GEEK