Analysis and Predicting Stock Trends with Python
This article is a tutorial on predicting stock trends using Linear Regression in Python.
Requirements:
- Python 3.0
- Pip
Install the following packages:
- pandas — BSD-licensed library providing high-performance, easy-to-use data structures, and data analysis tools.
- sklearn — provides dozens of built-in machine learning algorithms and models
- matplotlib — Plotting library which produces publication quality figures
pip install pandas sklearn matplotlib
What is a Linear Regression?
In statistics, linear regression is a linear approach to modeling the relationship between a scalar response (or dependent variable) and one or more explanatory variables (or independent variables). The case of one explanatory variable is called a simple linear regression. For more than one explanatory variable, the process is called multiple linear regression. This term is distinct from multivariate linear regression, where multiple correlated dependent variables are predicted, rather than a single scalar variable.

Stock Data: Tesla Stock Data from Yahoo Finance

Let’s import the required libraries/modules
import pandas as pd
from sklearn.model_selection import train_test_split
from sklearn.linear_model import LinearRegression
from sklearn.preprocessing import LabelEncoder
from sklearn.metrics import mean_squared_error
import matplotlib.pyplot as plt
Reading data from CSV file
#Import the data
data = pd.read_csv("TSLA.csv")
print('Raw data from Yahoo Finance : ')
print(data.head())
Removing unwanted Columns from the Data Frame
#Remove date and Adj Close columns
data = data.drop('Date',axis=1)
data = data.drop('Adj Close',axis = 1)
print('\n\nData after removing Date and Adj Close : ')
print(data.head())
Splitting the data into training and test sets
In this tutorial, we are predicting the Close amount at EOD for Tesla’s stock. For this, we have removed the Date and Adjusted Close Amount from the raw data. We split the data into a 75–25 ratio for training and testing data.
#Split into train and test data
data_X = data.loc[:,data.columns !=  'Close' ]
data_Y = data['Close']
train_X, test_X, train_y,test_y = train_test_split(data_X,data_Y,test_size=0.25)
print('\n\nTraining Set')
print(train_X.head())
print(train_y.head())
Creating the Regressor from sci-kit learn’s Linear Regression Module
#Creating the Regressor
regressor = LinearRegression()
regressor.fit(train_X,train_y)
Make predictions and evaluate the results
#Make Predictions and Evaluate the results
predict_y = regressor.predict(test_X)
print('Prediction Score : ' , regressor.score(test_X,test_y))

error = mean_squared_error(test_y,predict_y)
print('Mean Squared Error : ',error)
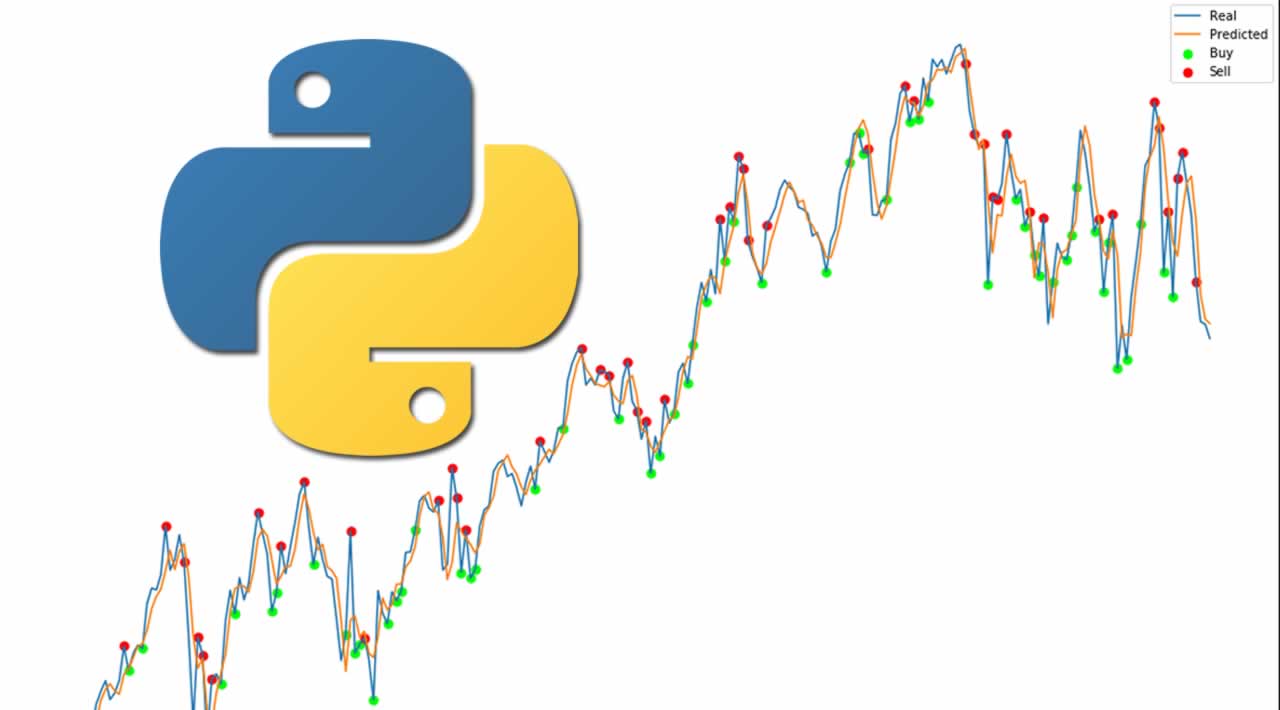
Plot the predicted and actual values
#Plot the predicted and the expected values
fig = plt.figure()
ax = plt.axes()
ax.grid()
ax.set(xlabel='Close ($)',ylabel='Open ($)', title='Tesla Stock Prediction using Linear Regression')
ax.plot(test_X['Open'],test_y)
ax.plot(test_X['Open'],predict_y)
fig.savefig('LRPlot.png')
plt.show()

Snip of the Output of the above code snippet

I hope this article was helpful, do leave some claps if you liked it. Thank you for reading!
#python #machine learning #programming #data