1. Theory
When we define a statistical model focused on a dependent variable, we attempt to explain the relationship between that dependent variable and other independent variable(s).
To compute these models, we need to vectorize our variables and align them in a way that every** column is a variable** (discretized) and every row is an observation of the variables in a given point of a common axis. This is mandatory for applications (such as machine learning) which require a tidy dataset as input.
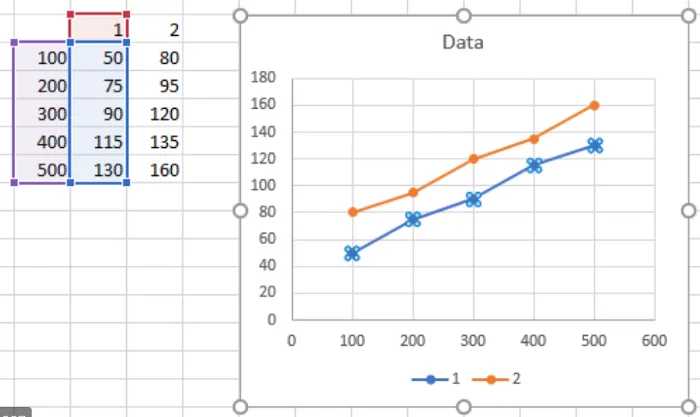
To show it in a simple example:
Above, two variables are both graphed and vectorized sharing a common axis, the horizontal axis.
We can compute the relationship between two variables (create a tidy dataset with them) as long as these 2 conditions are met:
- The variables must share a common Axis to be aligned with
- The independent variable(s) must **cover the range **of the dependent variable on that common Axis
So, intuitively, if we want to add a variable (or feature) from other data source to ours, the first condition means that we need a common ‘key’ column to ‘join’ them by.
The second condition means that on that key column, the external variable must have a matching value for every one of our variable’s own.
This way** our variable remains intact **and we have a pair value of the other(s). We can accomplish the gathering of variables by using the Proximity Blend Algorithm to impute by common axis, as we can see on the image below.
#data-blending #data-science #ai #python #machine-learning