Python debug configurations in Visual Studio Code
The Python extension supports debugging of a number of types of Python applications. For a short walkthrough of basic debugging, see Tutorial - Configure and run the debugger. Also see the Flask tutorial. Both tutorials demonstrate core skills like setting breakpoints and stepping through code.
For general debugging features such as inspecting variables, setting breakpoints, and other activities that aren’t language-dependent, review VS Code debugging.
This article addresses only those considerations that are specific to Python, mainly Python-specific debugging configurations, including the necessary steps for specific app types and remote debugging.
Initialize configurations
A configuration drives VS Code’s behavior during a debugging session. Configurations are defined in a launch.json file that’s stored in a .vscode folder in your workspace.
Note In order to change debugging configuration, your code must be stored in a folder.
To initialize debug configurations, first select the Debug View in the sidebar:
![]()
If you don’t yet have any configurations defined, you’ll see “No Configurations” in the drop-down list, and a dot on the settings icon:
![]()
To generate a launch.json file with Python configurations, do the following steps:
-
Select the settings button (circled in the image above) or use the Debug > Open configurations menu command.
-
A configuration menu will open from the Command Palette allowing you to choose the type of debug configuration you want for the opened file. For now, in the Select a debug configuration menu that appears, select Python File.

Note Starting a debugging session through the Debug Panel, F5 or Debug > Start Debugging, when no configuration exists will also bring up the debug configuration menu.
- The Python extension then creates and opens a
launch.jsonfile that contains a pre-defined configuration based on what you previously selected, in this case Python File. You can modify configurations (to add arguments, for example), and also add custom configurations.

The details of configuration properties are covered later in this article under Standard configuration and options. Additional configurations are also described in this article under Debugging specific app types.
Additional configurations
By default, VS Code shows only the most common configurations provided by the Python extension. You can select other configurations to include in launch.json by using the Add Configuration command shown in the list and in the launch.json editor. When you use the command, VS Code prompts you with a list of all available configurations (be sure to scroll down to see all the Python options):
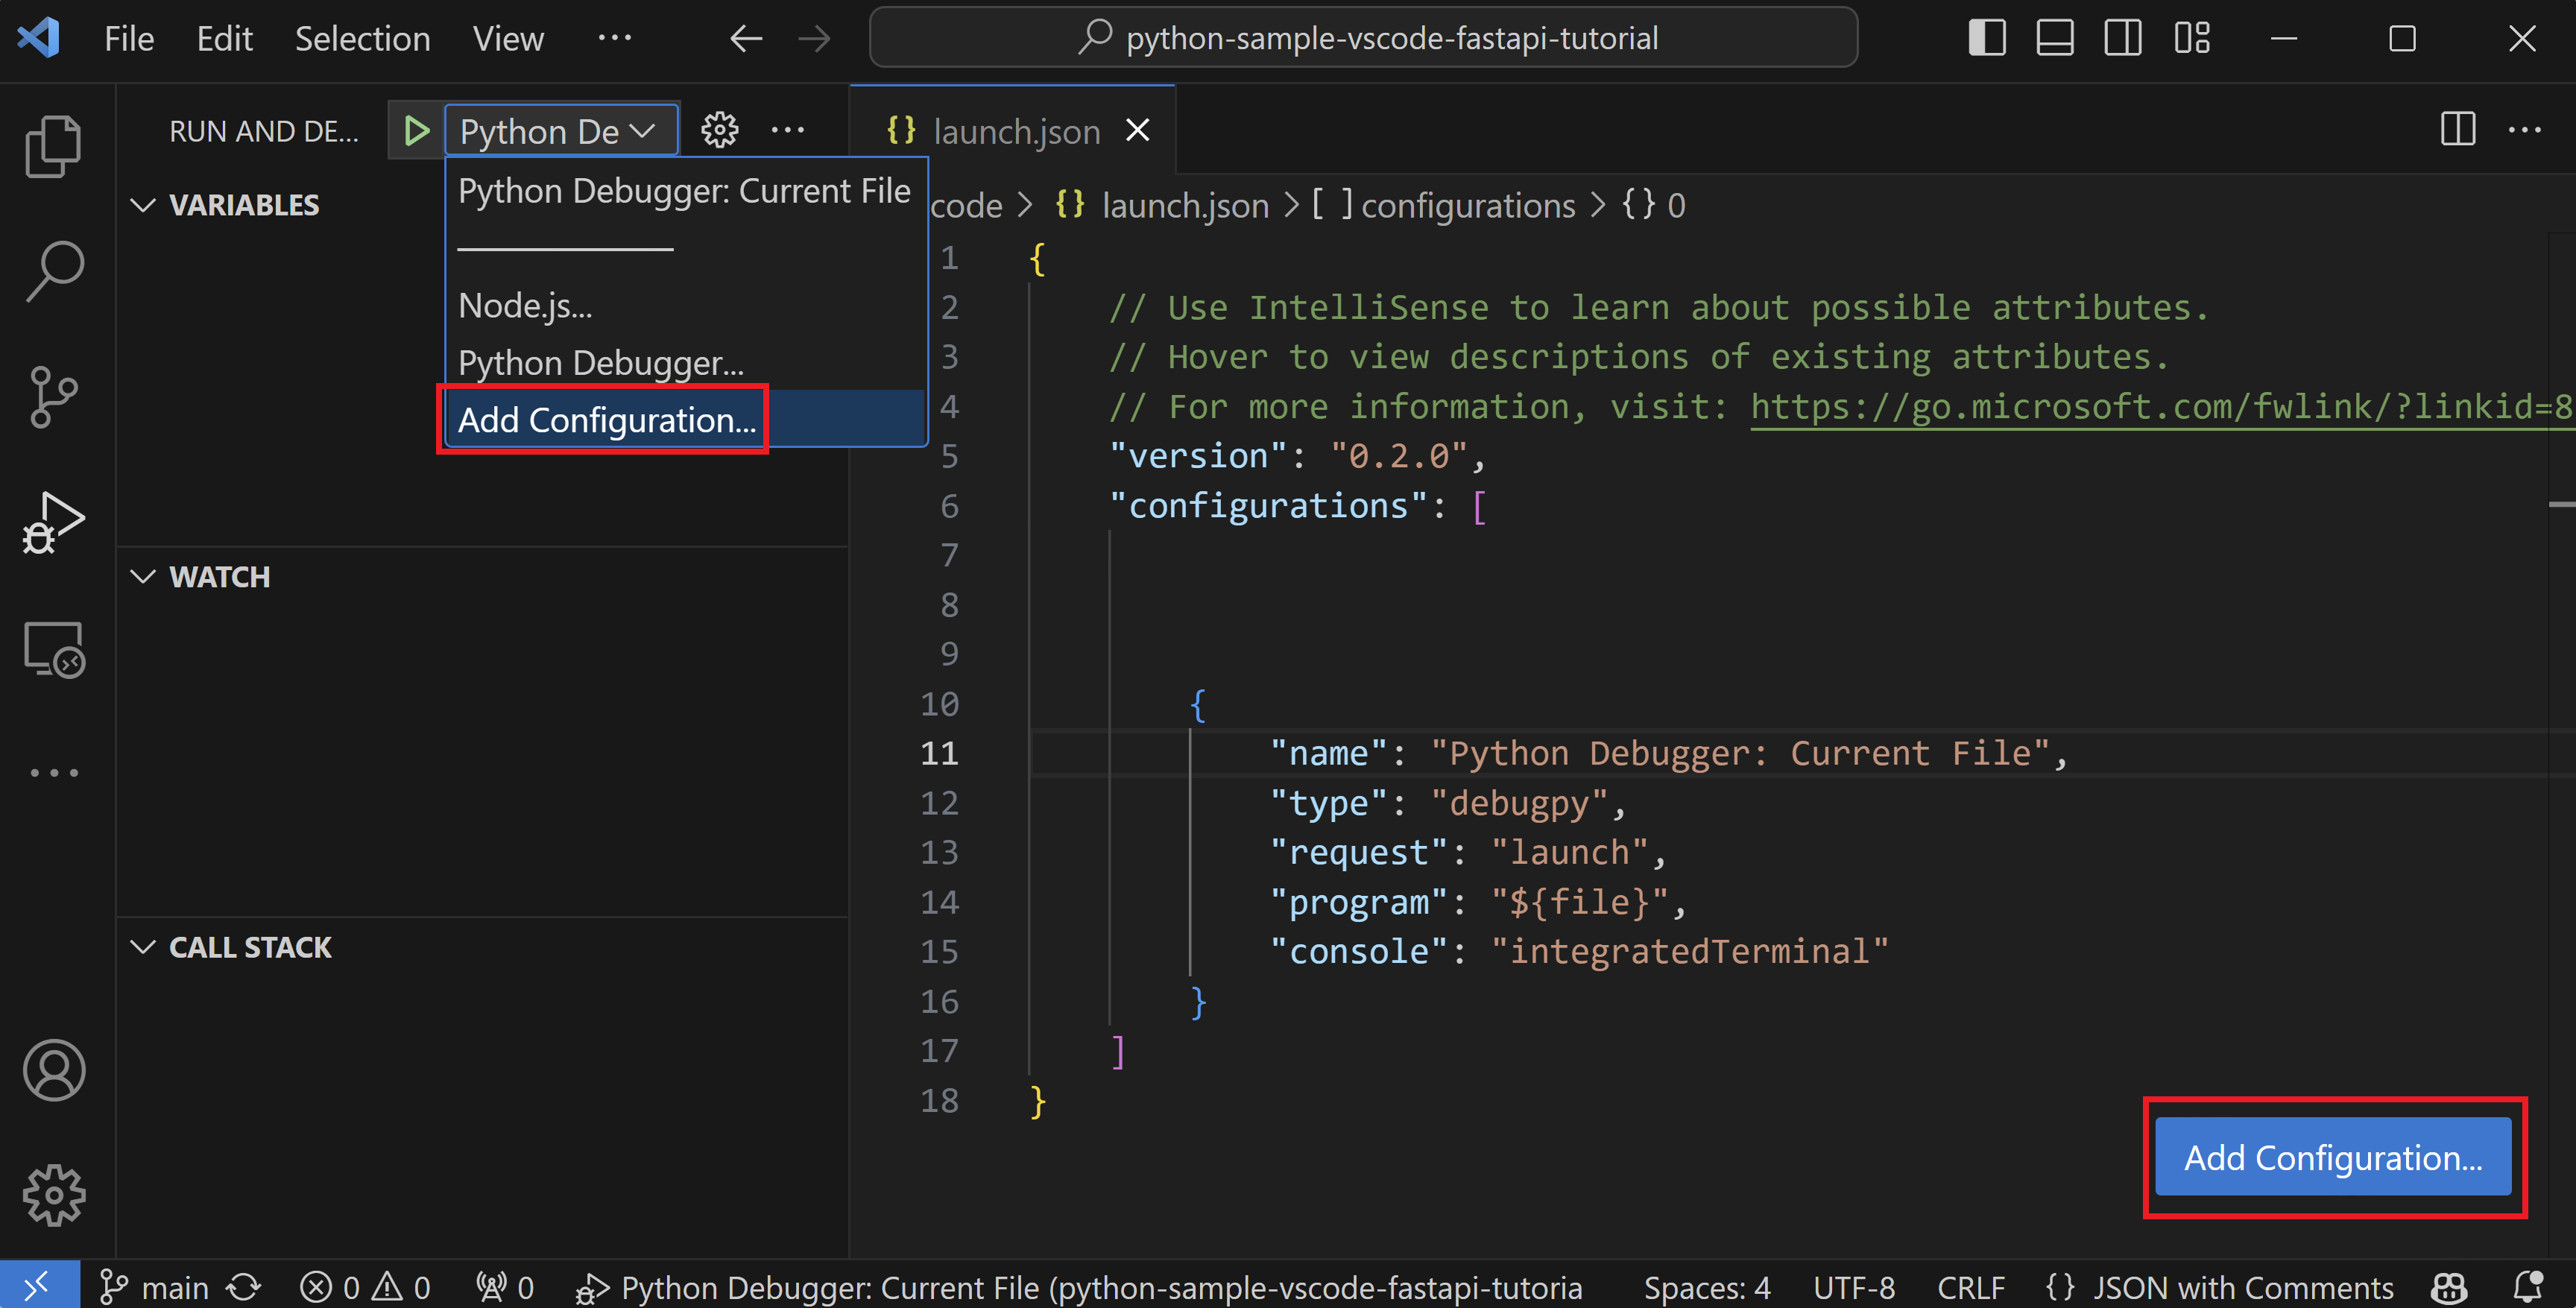
Selecting the Node.js: Gulp task yields the following result:

See Debugging specific app types for details on all of these configurations.
During debugging, the Status Bar shows the current configuration on the lower left; to its right is the current debugging interpreter. Selecting the configuration brings up a list from which you can choose a different configuration:

By default, the debugger uses the same python.pythonPath workspace setting as for other features of VS Code. To use a different interpreter for debugging specifically, set the value for pythonPath in launch.json for the applicable debugger configuration as described in the next section. Alternately, select the named interpreter on the Status Bar to select a different one, which updates python.pythonPath.
Set configuration options
When you first create launch.json, there are two standard configurations that run the active file in the editor in either the integrated terminal (inside VS Code) or the external terminal (outside of VS Code):
{
    "name": "Python: Current File (Integrated Terminal)",
    "type": "python",
    "request": "launch",
    "program": "${file}",
    "console": "integratedTerminal"
},
{
    "name": "Python: Current File (External Terminal)",
    "type": "python",
    "request": "launch",
    "program": "${file}",
    "console": "externalTerminal"
}
The specific settings are described in the following sections. You can also add other settings, such as args, that aren’t included in the standard configurations.
Tip: It’s often helpful in a project to create a configuration that runs a specific startup file. For example, if you want to always launch
startup.pywith the arguments--port 1593when you start the debugger, create a configuration entry as follows:{ "name": "Python: startup.py", "type": "python", "request": "launch", "program": "${workspaceFolder}/startup.py", "args" : ["--port", "1593"] },
name
Provides the name for the debug configuration that appears in the VS Code drop-down list.
type
Identifies the type of debugger to use; leave this set to python for Python code.
request
Specifies the mode in which to start debugging:
launch: start the debugger on the file specified inprogramattach: attach the debugger to an already running process. See Remote debugging for an example.
program
Provides the fully qualified path to the python program’s entry module (startup file). The value ${file}, often used in default configurations, uses the currently active file in the editor. By specifying a specific startup file, you can always be sure of launching your program with the same entry point regardless of which files are open. For example:
"program": "/Users/Me/Projects/PokemonGo-Bot/pokemongo_bot/event_handlers/__init__.py",
You can also rely on a relative path from the workspace root. For example, if the root is /Users/Me/Projects/PokemonGo-Bot then you can use the following:
"program": "${workspaceFolder}/pokemongo_bot/event_handlers/__init__.py",
pythonPath
Points to the Python interpreter to be used for debugging, which can be a folder containing a Python interpreter. The value can use variables like ${workspaceFolder} and ${workspaceFolder}/.venv.
If not specified, this setting defaults to the interpreter identified in the python.pythonPath setting, which is equivalent to using the value ${config:python.pythonPath}. To use a different interpreter, specify its path instead in the pythonPath property of a debug configuration.
You can specify platform-specific paths by placing pythonPath within a parent object named osx, windows, or linux. For example, the configuration for PySpark uses the following values:
"osx": {
    "pythonPath": "^\"\\${env:SPARK_HOME}/bin/spark-submit\""
},
"windows": {
    "pythonPath": "^\"\\${env:SPARK_HOME}/bin/spark-submit.cmd\""
},
"linux": {
    "pythonPath": "^\"\\${env:SPARK_HOME}/bin/spark-submit\""
},
Alternately, you can use a custom environment variable that’s defined on each platform to contain the full path to the Python interpreter to use, so that no additional folder paths are needed.
args
Specifies arguments to pass to the Python program. Each element of the argument string that’s separated by a space should be contained within quotes, for example:
"args": ["--quiet", "--norepeat", "--port", "1593"],
stopOnEntry
When set to true, breaks the debugger at the first line of the program being debugged. If omitted (the default) or set to false, the debugger runs the program to the first breakpoint.
console
Specifies how program output is displayed.

cwd
Specifies the current working directory for the debugger, which is the base folder for any relative paths used in code. If omitted, defaults to ${workspaceFolder} (the folder open in VS Code).
As an example, say ${workspaceFolder} contains a py_code folder containing app.py, and a data folder containing salaries.csv. If you start the debugger on py_code/app.py, then the relative paths to the data file vary depending on the value of cwd:

redirectOutput
When omitted or set to true (the default), causes the debugger to print all output from the program into the VS Code debug output window. If set to false, program output is not displayed in the debugger output window.
This option is typically disabled when using "console": "integratedTerminal" or "console": "externalTerminal" because there’s no need to duplicate the output in the debug console.
justMyCode
When omitted or set to true (the default), restricts debugging to user-written code only. Set to false to also enable debugging of standard library functions.
django
When set to true, activates debugging features specific to the Django web framework.
sudo
When set to true and used with "console": "externalTerminal", allows for debugging apps that require elevation. Using an external console is necessary to capture the password.
pyramid
When set to true, ensures that a Pyramid app is launched with the necessary pserve command.
env
Sets optional environment variables for the debugger process beyond system environment variables, which the debugger always inherits. The values for these variables must be entered as strings.
envFile
Optional path to a file that contains environment variable definitions. See Configuring Python environments - environment variable definitions file.
gevent
If set to true, enables debugging of gevent monkey-patched code.
Invoking a breakpoint in code
In your Python code, you can call breakpoint() at any point where you want to pause the debugger during a debugging session.
Breakpoint validation
The Python extension automatically detects breakpoints that are set on non-executable lines, such as pass statements or the middle of a multiline statement. In such cases, running the debugger moves the breakpoint to nearest valid line to ensure that code execution stops at that point.
Attach to a local script
In some scenarios, you need to debug a Python script that’s invoked locally by another process. For example, you may be debugging a web server that runs different Python scripts for specific processing jobs. In such cases, you need to attach the VS Code debugger to the script once it’s been launched:
-
Run VS Code, open the folder or workspace containing the script, and create a
launch.jsonfor that workspace if one doesn’t exist already. -
In the script code, add the following and save the file:
import ptvsd # 5678 is the default attach port in the VS Code debug configurations print("Waiting for debugger attach") ptvsd.enable_attach(address=('localhost', 5678), redirect_output=True) ptvsd.wait_for_attach() breakpoint() -
Open a terminal using Terminal: Create New Integrated Terminal, which activates the script’s selected environment.
-
In the terminal, install the ptvsd package with
python -m pip install --upgrade ptvsd. -
In the terminal, start Python with the script, for example,
python3 myscript.py. You should see the “Waiting for debugger attach” message that’s included in the code, and the script halts at theptvsd.wait_for_attach()call. -
Switch to the Debug view, select Python: Attach from the debugger drop-down list, and start the debugger.
-
The debugger should stop on the
breakpoint()call, from which point you can use the debugger normally. You can, of course, set other breakpoints in the script code instead of usingbreakpoint().
Note: In the future, the Python extension will support attaching the debugger by process ID instead of host and port. See Issue 1078.
Remote debugging
Remote debugging allows you to step through a program locally within VS Code while it runs on a remote computer. It is not necessary to install VS Code on the remote computer.
-
Both computers: make sure that identical source code is available.
-
Both computers: install ptvsd using
python -m pip install --upgrade ptvsdinto your environment (while using a form of virtual environment is not required, it is a recommended best practice). -
Remote computer: open the port you wish to use for debugging in the appropriate firewall or other networking configuration.
-
Remote computer: there are two ways to specify how to attach to the remote process. You may need to specify the remote computer’s private IP address, if applicable (Linux VMs on Azure, for example, have both a public and private address). If you use the public IP address, you might see the error “Cannot assign requested address.”
-
In the source code, add the following lines, replacing
addresswith the remote computer’s IP address and port number (IP address 1.2.3.4 is shown here for illustration only).``` import ptvsd # Allow other computers to attach to ptvsd at this IP address and port. ptvsd.enable_attach(address=('1.2.3.4', 3000), redirect_output=True) # Pause the program until a remote debugger is attached ptvsd.wait_for_attach() ```
The IP address used in enable_attach should be the remote computer’s private IP address. You can then launch the program normally, causing it to pause until the debugger attaches.
-
Launch the remote process through ptvsd, for example:
```
python3 -m ptvsd --host 1.2.3.4 --port 3000 --wait -m myproject
```
This starts the package myproject using python3, with the remote computer’s private IP address of 1.2.3.4 and listening on port 3000 (you can also start the remote Python process by specifying a file path instead of using -m).
-
Local computer: Only if you modified the source code on the remote computer as outlined above, then in the source code, add a commented-out copy of the same code added on the remote computer. Adding these lines makes sure that the source code on both computers matches line by line.
#import ptvsd # Allow other computers to attach to ptvsd at this IP address and port. #ptvsd.enable_attach(address=('1.2.3.4', 3000), redirect_output=True) # Pause the program until a remote debugger is attached #ptvsd.wait_for_attach() -
Local computer: switch to Debug View in VS Code, select the Python: Attach configuration, and select the settings (gear) icon to open
launch.jsonto that configuration. -
Local computer: Modify the configuration so that
remoteRootprovides the location of the program on the remote computer’s file system. Also modifyhostandportto match the values in theptvsd.enable_attachcall added to the source code, except that you need to use the remote computer’s public IP address forhost. You might also changenameto specifically identify the configuration. For example:{ "name": "Python Attach (Remote Debug 192.168.34.156)", "type": "python", "request": "attach", "pathMappings": [ { "localRoot": "${workspaceFolder}", // You may also manually specify the directory containing your source code. "remoteRoot": "~/hello" // Linux example; adjust as necessary for your OS and situation. } ], "port": 3000, // Set to the remote port. "host": "1.2.3.4" // Set to your remote host's public IP address. } -
Local computer: set a breakpoint in the code where you want to start debugging.
Tip: setting a single breakpoint on the statement immediately following the
ptvsd.wait_for_attach()line may not work. Set at least one other breakpoint on another statement.
- Local computer: start the VS Code debugger using the modified Python Attach configuration. VS Code should stop on your locally set breakpoints, allowing you to step through the code, examine variables, and perform all other debugging actions. Expressions that you enter in the Debug Console are run on the remote computer as well.
Text output to stdout, as from print statements, appears on both computers. Other outputs, such as graphical plots from a package like matplotlib, however, appear only on the remote computer.
- During remote debugging, the debugging toolbar appears as below:

On this toolbar, the disconnect button (Shift+F5) stops the debugger and allows the remote program to run to completion. The restart button (Ctrl+Shift+F5) restarts the debugger on the local computer but does not restart the remote program. Use the restart button only when you’ve already restarted the remote program and need to reattach the debugger.
Debugging over SSH
In some cases, you may want or need to use a secure connection to the remote computer when debugging. On Windows computers, you may need to install OpenSSH or Windows 10 OpenSSH to have the ssh command.
On the remote computer:
-
Enable port forwarding by opening the
sshd_configconfig file (found under/etc/ssh/on Linux and under%programfiles(x86)%/openssh/etcon Windows) and adding or modifying the following setting:AllowTcpForwarding yes -
Restart the SSH server. On Linux/macOS, run
sudo service ssh restart; on Windows, runservices.msc, locate and select OpenSSH orsshdin the list of services, and select Restart. -
Start the Python program and let it wait for the debugger to attach as described in the previous section.
On the local computer:
-
Create an SSH tunnel by running
ssh -L sourceport:localhost:destinationport user@remoteaddress, using a selected port fordestinationportand the appropriate username and the remote computer’s IP address inuser@remoteaddress. For example, to use port 3000 on IP address 1.2.3.4, the command would bessh -L 3000:localhost:3000 user@1.2.3.4. -
Verify that you can see a prompt in the SSH session.
-
In VS Code, set the port in the debug configuration of
launch.jsonto match the port used in thesshcommand and set the host tolocalhost. You uselocalhosthere because you’ve set up the SSH tunnel. -
Launch the program and attach the debugger as described in the previous section.
Debugging specific app types
The configuration drop-down provides a variety of different options for general app types:

Specific steps are also needed for remote debugging and Google App Engine. For details on debugging tests (including nosetest), see Testing.
To debug an app that requires administrator privileges, use "console": "externalTerminal" and "sudo": "True".
Flask debugging
{
    "name": "Python: Flask",
    "type": "python",
    "request": "launch",
    "module": "flask",
    "env": {
        "FLASK_APP": "app.py"
    },
    "args": [
        "run",
        "--no-debugger",
        "--no-reload"
    ],
    "jinja": true
},
As you can see, this configuration specifies "env": {"FLASK_APP": "app.py"} and "args": ["run", "--no-debugger","--no-reload"]. The "module": "flask" property is used instead of program. (You may see "FLASK_APP": "${workspaceFolder}/app.py" in the env property, in which case modify the configuration to refer to only the filename. Otherwise you may see “Cannot import module C” errors where C is a drive letter.)
The "jinja": true setting also enables debugging for Flask’s default Jinja templating engine.
If you want to run Flask’s development server in development mode, use the following configuration:
{
    "name": "Python: Flask (development mode)",
    "type": "python",
    "request": "launch",
    "module": "flask",
    "env": {
        "FLASK_APP": "app.py",
        "FLASK_ENV": "development"
    },
    "args": [
        "run"
    ],
    "jinja": true
},
Google App Engine debugging
Google App Engine launches an app by itself, so launching it in the VS Code debugger isn’t directly possible. What’s required instead is to use ptvsd in the app and then launch Google App Engine in a mode that allows VS Code to attach its debugger.
-
Download ptvsd and extract its files into a ptvsd folder in your working folder. (If using a different folder, modify the path in the
pydev_startup.pyfile created in step 4). -
Create a
tasks.jsonfile with the following contents:{ "version": "2.0.0", "tasks": [ { "label": "Launch Google App Engine", "command": "python", "type": "shell", "args": [ "/usr/local/google_appengine/dev_appserver.py", "--python_startup_script=${workspaceFolder}/pydev_startup.py", "--automatic_restart=no", "--max_module_instances=default:1", "${workspaceFolder}/app.yaml" ] } ] } -
On Windows and Linux, replace the first item in
argswith the path to wherever Google App Engine is installed (the path shown in the source code above is for macOS). -
Create a file named
pydev_startup.pyin your project root with the following contents, modified as noted:import sys import os # Assuming that pdvsd is located in the working folder sys.path.append(os.getcwd()) import ptvsd # Modify the port number as desired; you're debugging locally so the values don't matter. # However, be sure the port is not blocked on your computer. ptvsd.enable_attach(address=('0.0.0.0', 3000), redirect_output=True) # The debug server has started and you can now use VS Code to attach to the application for debugging print("Google App Engine has started; ready to attach the debugger") -
Create a
launch.jsonconfiguration using the Attach (Remote Debug) configuration as a template. Make sure the port value matches what’s in the source code above. -
Add
"preLaunchTask": "python"tolaunch.json. -
From the Command Palette, run the Run Build Task command. This command opens the Tasks output window where you see various messages.
-
Once you see the message “Google App Engine has started; ready to attach the debugger,” start the VS Code debugger using the remote debugging configuration.
-
Set breakpoints where you want, then start the browser to start the app.
Troubleshooting
There are many reasons why the debugger may not work. Oftentimes the debug console reveals specific causes, but two specific reasons are as follows:
-
The path to the python executable is incorrect: check the value of
pythonPathin your user settings. -
There are invalid expressions in the watch window (as in the example below): clear all expressions from the Watch window and restart the debugger.
Traceback (most recent call last): File ".../visualstudio_py_debugger.py", line 1646, in loop cmd() File ".../visualstudio_py_debugger.py", line 1918, in command_execute_code thread.run_on_thread(text, cur_frame, eid, frame_kind, repr_kind) File ".../visualstudio_py_debugger.py", line 1246, in run_on_thread self.schedule_work(lambda : self.run_locally(text, cur_frame, execution_id, frame_kind, repr_kind)) File ".../visualstudio_py_debugger.py", line 1238, in schedule_work self.unblock() File ".../visualstudio_py_debugger.py", line 1234, in unblock self._block_lock.release() RuntimeError: release unlocked lock -
If you’re working with a multi-threaded app that uses native thread APIs (such as the Win32
CreateThreadfunction rather than the Python threading APIs), it’s presently necessary to include the following source code at the top of whichever file you wish to debug:import ptvsd ptvsd.debug_this_thread()
#python #vscode