Stationarity is an important concept in the field of time series analysis with tremendous influence on how the data is perceived and predicted. When forecasting or predicting the future, most time series models assume that each point is independent of one another. The best indication of this is when the dataset of past instances is stationary. For data to be stationary, the statistical properties of a system do not change over time. This does not mean that the values for each data point have to be the same, but the overall behavior of the data should remain constant. From a purely visual assessment, time plots that do not show trends or seasonality can be considered stationary. More numerical factors in support of stationarity include a constant mean and a constant variance.
Trend_ = When there is a long-term increase or decrease in the data_
Seasonality_ = Reoccuring pattern at a fixed and known frequency based on a time of the year, week, or day_
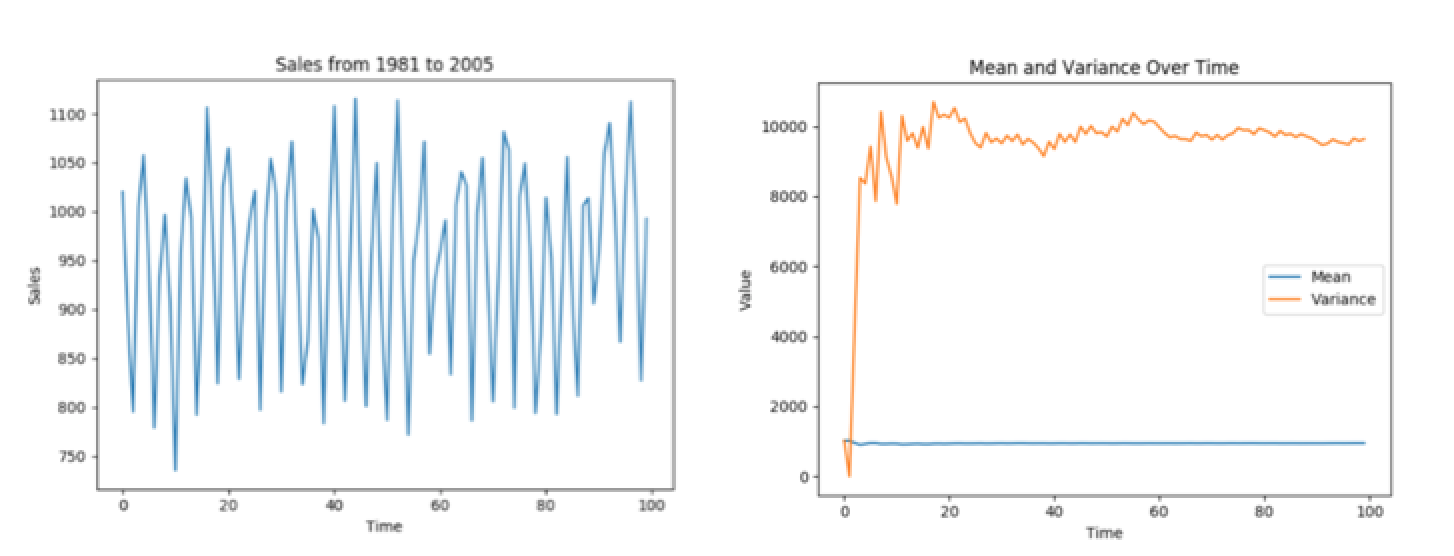
Example of Stationary Data
What if the Data is Not Stationary?
The figure below is a clear example of what non-stationary data looks like. The plot on the left has a strong positive trend with strong seasonality. Although this tells us a lot about the characteristics of the data, it is not stationary and therefore cannot be forecasted using traditional time series models. We need to transform the data in order to flatten the increasing variance.
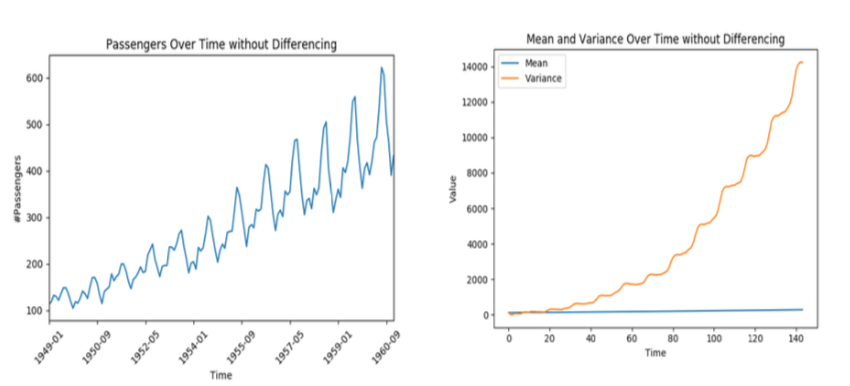
Number of Passengers Over Time & Mean and Variance Over Time
Since the data is non-stationary, you could perform a transformation to convert into a stationary dataset. The most common transforms are the difference and logarithmic transform.
#data-science #forecasting #machine-learning #data #data-analysis #data analysis