Unsurprisingly, a pass is the most common type of event to occur in football (or soccer for any Americans interested). A good passing game is vital to being successful in football as it enables you to dictate the play by keeping possession, saves energy and as a result presents you with a better chance of scoring. Passing is about using good technique to quickly, accurately, and properly deliver the ball, while making the right decisions at the right time.
Therefore, the importance of analysing player performance in this field should not be underestimated. But how can we quantify a players passing skill?
The classic metric is number of passes completed. However, using a binary label of either the pass is completed or not neglects the large variation in pass styles that exist between players and takes no account of flow of a team.
We know this variation in pass type exists because of the way in which pundits and commentators discuss it, ‘Great through ball’, ‘Aggressive pass’, ‘Poor ball’.
These descriptors are completely ignored when using binary labels.
This blog builds an expected pass model to alter this perception. I use an objective variable to measure pass quality on a continuous spectrum, to analyse the levels of risk involved in any pass based on previous pass data. For those interested in the full code, (including all on the visualisations) please feel free to check it out here.
The Data
The data I have used to build this expected pass model is based on 20 teams, playing 380 games and 358,783 total attempted passes.
The initial variables included:
- Team, Game, Player, Home, Away identifiers
- Home & Away Full Time Scores
- Half, Minute, Second
- Outcome of Pass (1 or 0)
- Locational identifiers of start x & y, end x & y of pass
- If the pass was either a normal pass or a header, cross, corner, throw, goal kick (or throw) or free kick
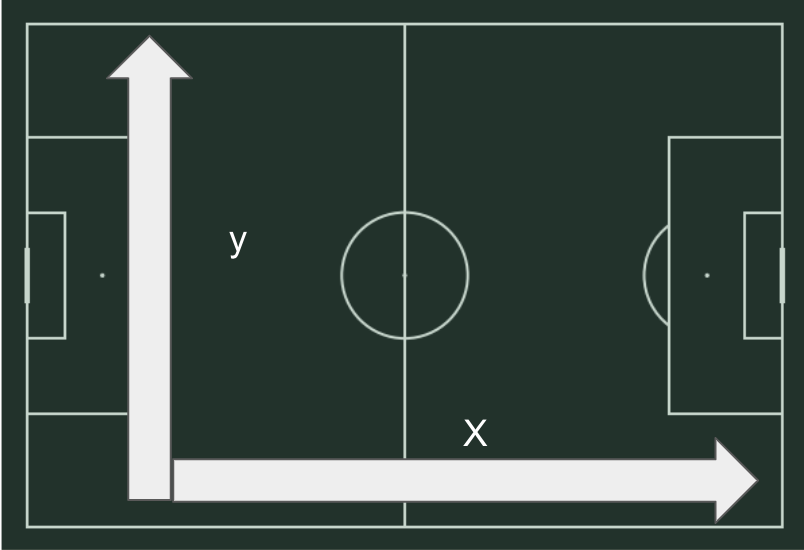
Image by Author
The coordinates assume a 105m X 68M pitch, and have been adjusted so that X goes from 0–105 in the attacking direction of play, and Y goes from right to left, from the perspective of the attacking team. E.G a pass originating from (x,y) = (95, 15) starts on the right hand side of the opposition box.
#sports #data-science #football #machine-learning #soccer