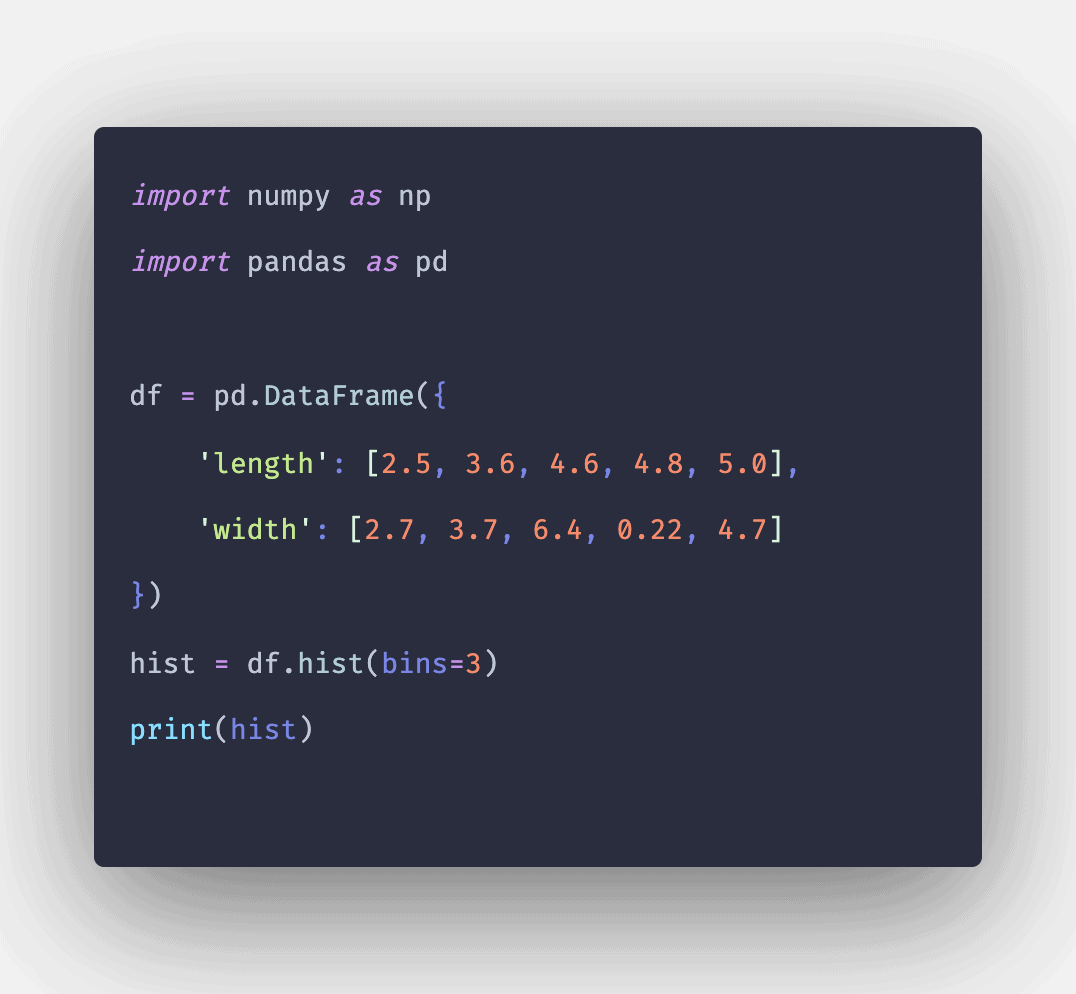
Pandas DataFrame hist() is a wrapper method for matplotlib pyplot API. The hist() method can be a handy tool to access the probability distribution. The function is called on each Series in the DataFrame, resulting in one histogram per column. The hist() function is used to create a histogram, which clears the idea of the distribution of certain numerical variables from the dataset.
Pandas DataFrame hist()
When exploring a dataset, you will often want to get a quick understanding of the distribution of certain numerical variables within it.
The standard way of visualizing the distribution of a single numerical variable is by using a histogram. A histogram divides the values within the numerical variable into “bins”, and counts a number of observations that fall into each bin.
#python