Many investors consider fundamental analysis as their secret weapon to beat the stock market. You can perform it using many methods, but one thing they have in common. They all need data about companies’ financial statements.
Luckily all stocks traded on US stock markets must quarterly report to the Securities and Exchange Commission (SEC). Every quarter SEC prepares a comfortable CSV package to help all the investors in their quest for the investment opportunity. Let’s explore how to get valuable insights from these .csv files.
In this tutorial, we will use python’s pandas library which ideal for parsing CSV files, and we will learn how to:
- explore the **structure **of the quarterly dump
- identify the records are we **interested **in
- get an idea of how many submission forms exist
- Delve into the content of 10-K, 8-K or 40-F forms
- Analyze if every company report only a single file each quarter
- Checks if the submission meet the SEC’s deadlines
We will process the data and:
- explore files in the SEC dump
- review each column of these files and talk about the most relevant
- remove **duplicated **data grouped by a key column or multiple columns
- visualize the data to support our exploration using interactive Plotly charts
- and much more
As usual, you can follow the code in the notebook shared on GitHub.
vaclavdekanovsky/data-analysis-in-examples
SEC Quarterly data
There doesn’t seem to be any problem. You simply download the quarterly package from the SEC dataset page, you sort the values from the financial statements in descending order and pick the stocks on the top. The reality isn’t that straightforward. Let’s have a look and explore 45.55MB big zip file with all SEC filings for the first quarter of 2020.
The package for every quarter contains 5 files. Here’s an example of 2020 Q1:
- readme.htm — describes the structure of the files
- **sub.txt **— master information about the submissions including company identifiers and type of the filing
- **num.txt **— numeric data for each financial statement and other documents
- tag.txt — standard taxonomy tags
- pre.txt — information about how the data from num.txt is displayed in the online presentation

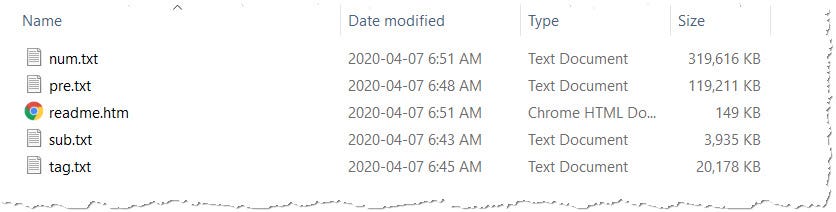
Unzipped files in the SEC quarterly data dump
This article will only deal with the submission master because it contains more than enough information for one article. Follow-up story will examine the data in more detail. Let’s begin.
2020Q1 Submission files
In the first quarter of 2020, the companies have submitted 13560 files and the sub.txt gathers 36 columns about them.
# load the .csv file into pandas
sub = pd.read_csv(os.path.join(folder,"sub.txt"), sep="\t", dtype={"cik":str})

# explore number of rows and columns
sub.shape
[Out]: (13560, 36)
I always start with a simple function that reviews each column of the data frame, checks the percentage of empty values, and how many unique values appear in the columns.
Explore the sub.txt file to see what data each column contain
Let me highlight a few important columns in the SEC submission master.

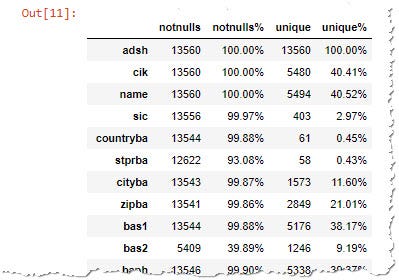
Example of the quick file overview in pandas
- adsh — EDGAR accession number uniquely identifies each report. This value is **never duplicated **in the sub.txt. Example 0001353283–20–000008 is the code for 10-K (yearly filing) of Splunk.
- cik — Central Index Key, unique key identifying each SEC registrant. E.g. 0001353283 for Splunk. As you can see the first part of the adsh is the cik.
- name — the name of the company submitting the quarterly financial data
- form — the type of the report being submitted
Form s— submissions types delivered to SEC
Based on the analysis, we see that the 2020Q1 submission contains 23 unique types of financial reports. Investors’ primary interest lies in the 10-K report, which covers the annual performance of the publically traded company. Because this report is expectedly delivered only once a year, important is also 10-Q report showing quarterly changes in the company’s financials.
10-KAnnual report of US-based company10-QQuarterly report and maybe20-FAnnual Reports of a foreign company40-FAnnual Reports of a foreign company (Canadian)
Let’s see which forms are the most common in the dataset. Plotting of the form types in the 2020Q1 will show this picture:
Using Plotly’s low level API to produce bar and pie subplots

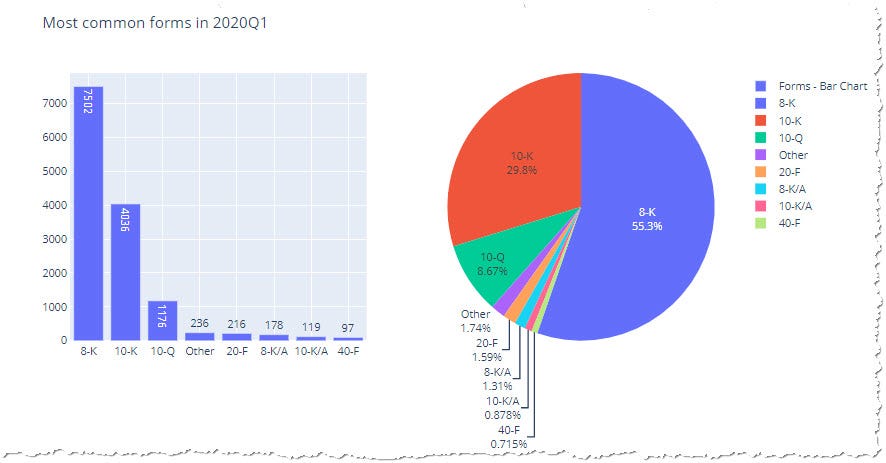
Different submission types reported by the companies in 2020Q1 using visualization in Plotly
The dataset contains over 7000 8-K reports notifying about important events like agreements, layoffs, usage of material, modification of shareholder rights, change in the senior positions, and more (see SEC’s guideline). Since they are the most common we should spend some time exploring them.
#stocks #exploratory-data-analysis #python #data-analysis #stock-market #data analysis