In this tutorial, we’d like to introduce you to the simple and easy method to dynamically implement and use Google Chart js in Laravel 8 application from scratch.
No matter how robust feature and rich data your application has, that means nothing if that doesn’t offer any value to your users. Consequently, the comprehensive notion always indicates displaying the data with utmost clarity to end-user. Also, user experience nitty-gritty also supports this argument.
Google Charts offer you the easy method to display data to users effectively; consequently, Google Chart js makes data representation task less complicated. Innumerable data can be displayed through the compendium of charts like Area Chart, Bar Chart, Pie Chart, Column Chart, and Geo Chart.
Fret not, if you are a novice developer who has a question about how to use google charts in Laravel 8 project, then I’ll show you cognize Laravel 8 Google chart example.
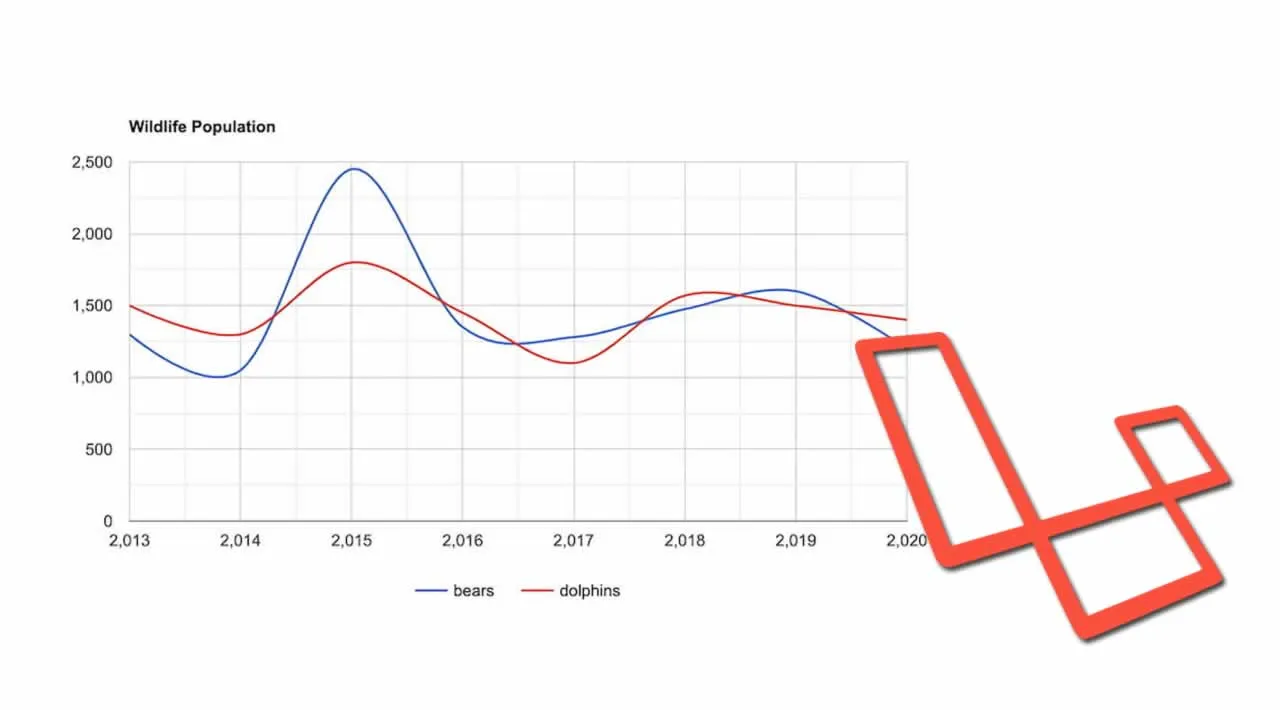
This tutorial gives you a facile example of dynamic Google Line Chart in Laravel 8 using Google charts JS API.
Let’s get started!
#laravel #laravel 8 #google charts