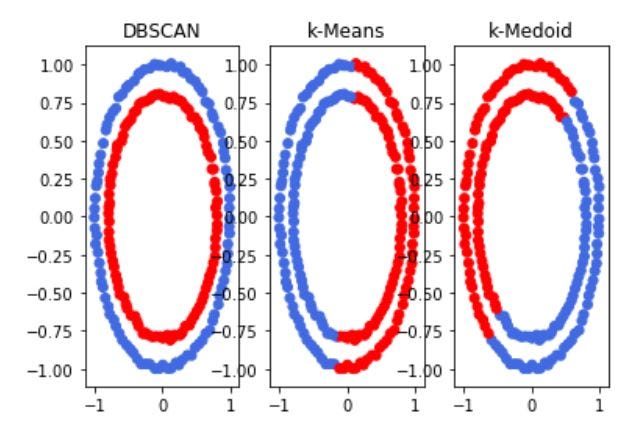
Clustering has significant use-cases across application domains to understand the overall variability structure of the data. Be it clustering of customers, students, genes, ECG Signals, images, prices of stock. We have used this successfully in feature selection and the optimization of the portfolio in some of our research articles, but more on those stories later. Clustering falls under the unsupervised category and by definition, it tries to find natural groups among the data.
Even in the era of deep learning, clustering can give you invaluable insight into the distribution of the data, which can affect your design decision.
In this article, we give you some overview of five clustering algorithms and the Kaggle notebook links where we have done some experiments. The purpose is to give you a quick summary and get you started on the application.
K- Means:
It is the simplest of all algorithms works based on distances. It’s a partitioning algorithm. Starts with k random points as the cluster centers and then for the rest of the points assign them to the closest cluster center. Once this assignment is done, recompute the cluster center. This process continues until there is no much change in the cluster assignment.
Some of the issues are:
a) we need to know the value of ‘k’
b) it is affected by outliers.
c) Depends on initialization
Some experiments are done in the following Kaggle notebook: https://www.kaggle.com/saptarsi/kmeans-dbs-sg
We start by explaining how k-means work, then with example describe why scaling is required. We also discuss how the Sum of Squared Error plotted using elbow plot is applied to find the optimal value of k. A simple example follows with ‘iris’
Corresponding Videos:
Theory: https://www.youtube.com/watch?v=FFhmNy0W4tE
Hands-on: https://www.youtube.com/watch?v=w0CTqS_KFjYK-Medoid:
K-Means is not robust against outliers. We move to the median and when we have more than one attribute and we want to find an overall median, which is called medoid. Some experiments are done using the following notebooks. To demonstrate the issue of outlying observations, we have done a small experiment of adding three outlying observations. As you know iris has three classes ( Setosa, Verginca, and Versicolor) and they are being plotted with two features. The addition of these features which are marked by the blue circle completely distorts the clustering. The original three classes are merged into two clusters and the outliers are in one cluster.
#algorithms
