Yoshua Bengio is a Deep Learning legend and won the Turing Award in 2018, along with Geoff Hinton and Yann LeCun.
In this short post, I want to highlight for you some clever things that Yoshua and his collaborators did to win a Machine Learning competition from a field of 381 competing teams. Perhaps these ideas will be useful for your own work.
In a world where powerful Deep Learning frameworks (e.g., TensorFlow, PyTorch) are a free download away, their competition-winning approach demonstrates nicely that your edge may come from how well you model the specifics of your problem.
(Caveat: This work was done in 2015. Given all the advancements in Deep Learning and computing hardware since then, Yoshua and team would probably solve the problem differently if the competition were held today)
The teams participating in the competition were given a dataset of all the taxi trips undertaken over a full year in the city of Porto in Portugal.
There were 1.7 million trips in the training dataset and for each trip, the important data elements were:
- GPS coordinates — latitude and longitude — of the taxi’s location measured every 15 seconds from the start of the trip to the finish. The first latitude-longitude pair is the starting point of the trip and the final latitude-longitude is the destination of the trip. For example, a taxi’s location at the start of a trip, 15 seconds later and 30 seconds later would look like this: [-8.578719,41.156271],[-8.578629,41.157693],[-8.578521,41.159439].
- the timestamp at the beginning of the trip
- taxi ID
- client ID (if the client requested the taxi by phone) or taxi-stand ID (if they got into the taxi at a taxi stand)
The challenge given to the participants is simply stated:
Given a partial trip (i.e., the latitude-longitude of the starting point and the next several consecutive points) and time/ID metadata, predict the latitude-longitude of the final destination.
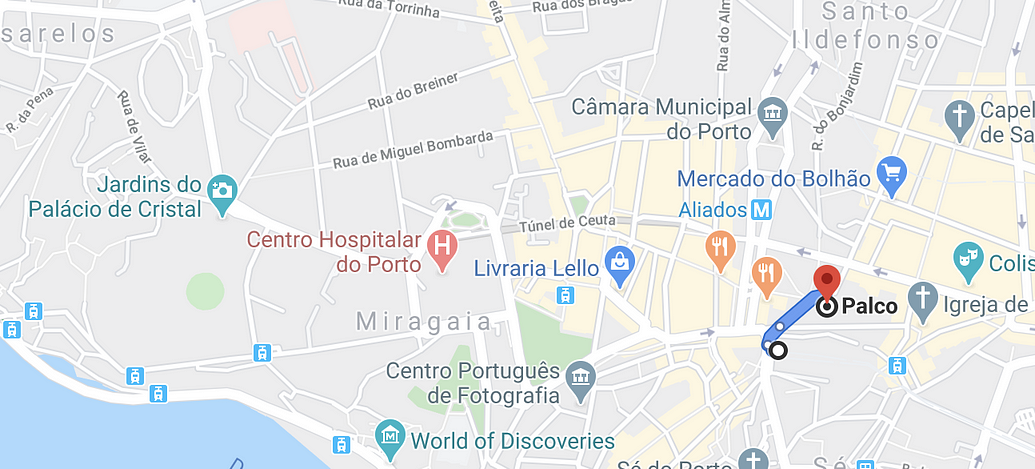
For example, let’s say a taxi trip started at the Sao Bento Station and ended at the Jardins do Palacio de Cristal, as shown below.

A partial trip would include the origin point and might be something like this:
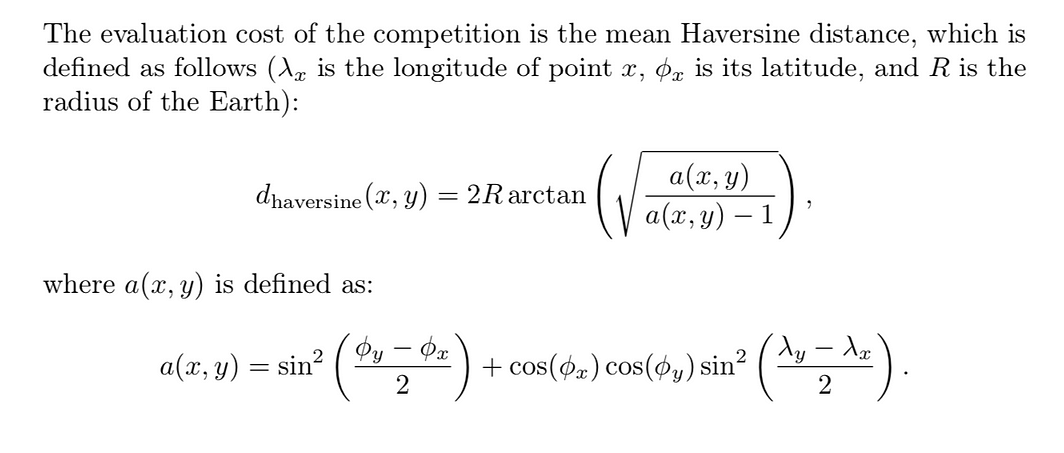
The test dataset had 320 partial trips. The evaluation metric was the distance between the predicted destination and the actual destination, averaged over the trips in the test dataset.
But the predicted and actual destinations are points on the surface of the earth (not points on a plane), so the distance between them is calculated NOT with the euclidean distance but with something called the Haversine distance:
https://arxiv.org/abs/1508.00021
Looks simple, right? :-)
#analytics #machine-learning #neural-networks #data-science #deep-learning